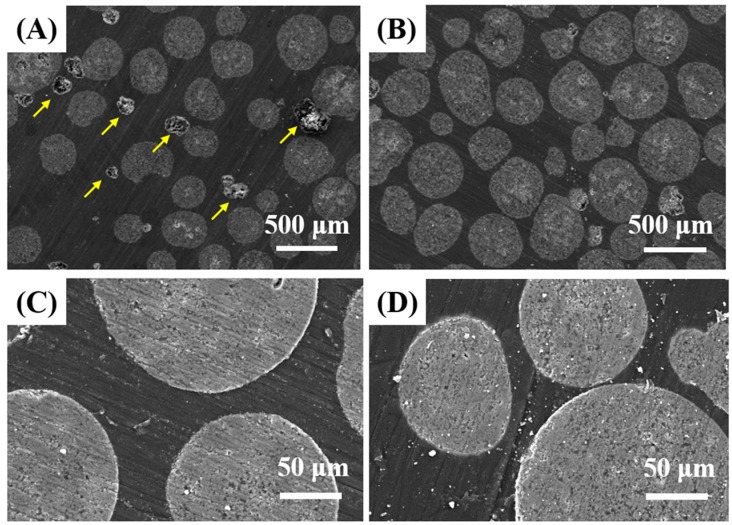
Figure 5.
Representative SEM images of PMMA/HA composites produced using the HA microspheres with various HA contents of 20 vol % (A,C) and 40 vol % (B,D), showing distribution of the HA microspheres in the PMMA matrix (A,B) and interfacial bonding between the HA microspheres and PMMA (C,D). Yellow arrows indicate voids formed during the grinding process for SEM observations.

