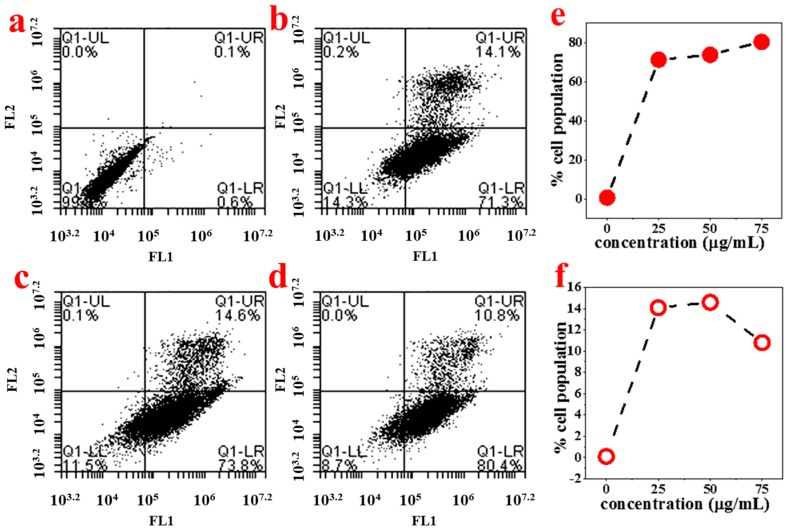
Figure 8.
Histograms from FACS analysis at each ABMP concentration. The FL1 channel was used to detect annexin V-FITC staining, and the FL2 channel was for PI staining. (a) Control; (b) 25 μg/mL; (c) 50 μg/mL; (d) 75 μg/mL; (e) percentage of early apoptotic cells stained with annexin-V-FITC at various concentrations of ABMP; (f) percentage of late apoptotic or necrotic cells stained with both annexin V-FITC and PI at various concentrations of ABMP.

