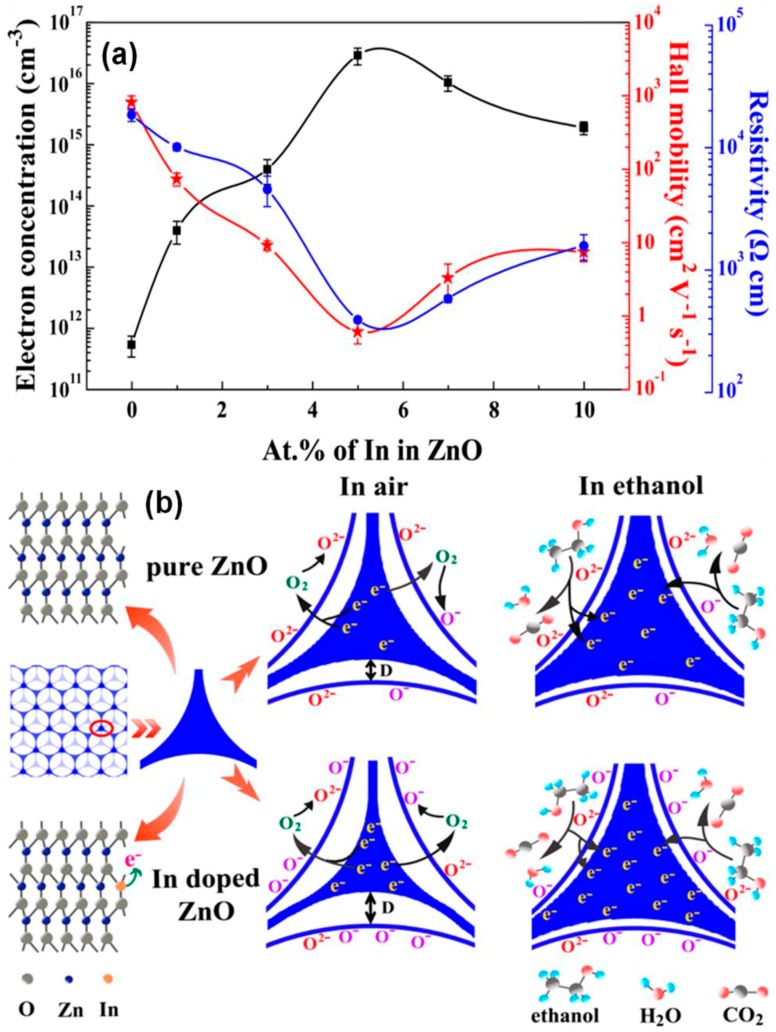
Figure 10.
(a) Electron carrier concentration, resistivity, and Hall mobility of the 3 dimentional macroporous structures; the error bars represent the SD of the determinations for three independent samples; (b) Schematic diagram of ethanol sensing on the surface of pure and In-doped 3DOM ZnO. Adapted figure from [85] with permission from copyright (2016), American Chemical Society, (Washington, DC, USA).

