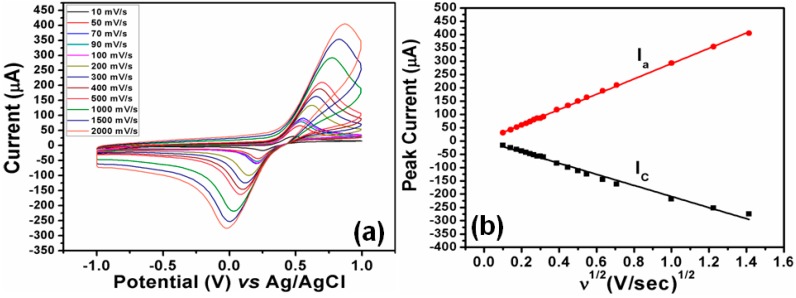
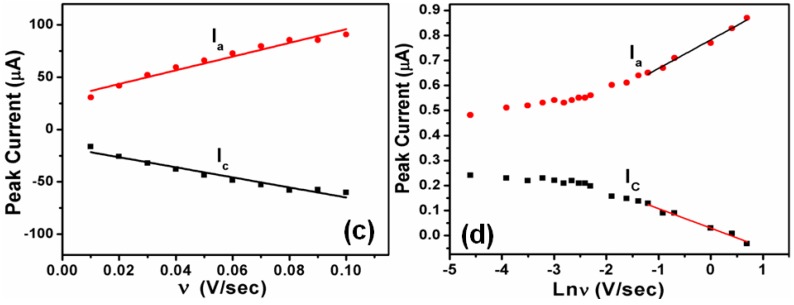
Figure 11.
(a) Cyclic voltammograms obtained for ZnO nanoparticles/GC electrode in 0.1 M PBS (pH = 7.4), containing 5 mM hydroquinone at various scan rates of 10, 50, 70, 90, 100, 200, 300, 400, 500, 1000, 1500, and 2000 mV/s; (b) Plot for the anodic and cathodic peak current versus the square root of the scan rates in the same solution; (c) Plot for the anodic and cathodic peak current versus the scan rates in same solution; and (d) Plot for the anodic and cathodic peak current versus the natural Log of scan rates in the same solution. Adapted figure from [91] with permission from copyright (2014), American Scientific Publishers (Los Angeles, CA, USA).


