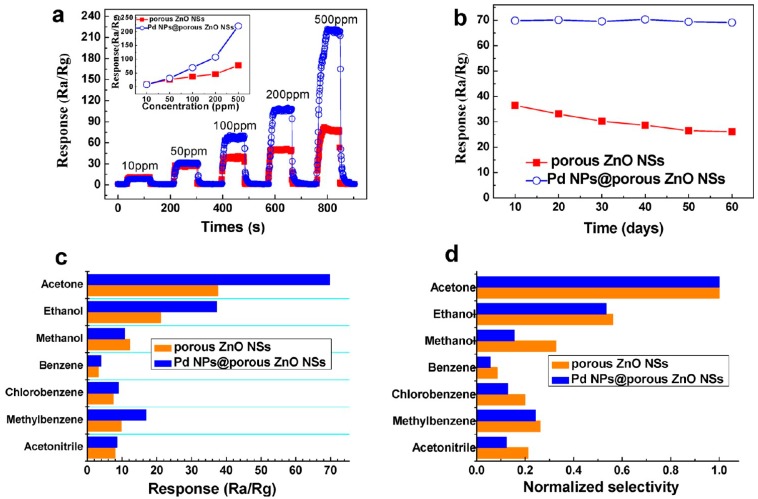
Figure 12.
(a) Dynamic responses to acetone at concentrations ranging from 10 to 500 ppm of acetone sensors made with Pd−ZnO−Nnanosphere and ZnO−nanosphere at optimized operating temperatures. The inset shows response vs concentration curves of the corresponding sensors; (b) Stability studies of sensors exposed to 100 ppm acetone; (c) The selectivity of the acetone sensors to reducing gases; and (d) The corresponding normalized selectivity of sensors from (c). Adapted figure from [92] with permission from copyright (2012), American Chemical Society (Washington, DC, USA).

