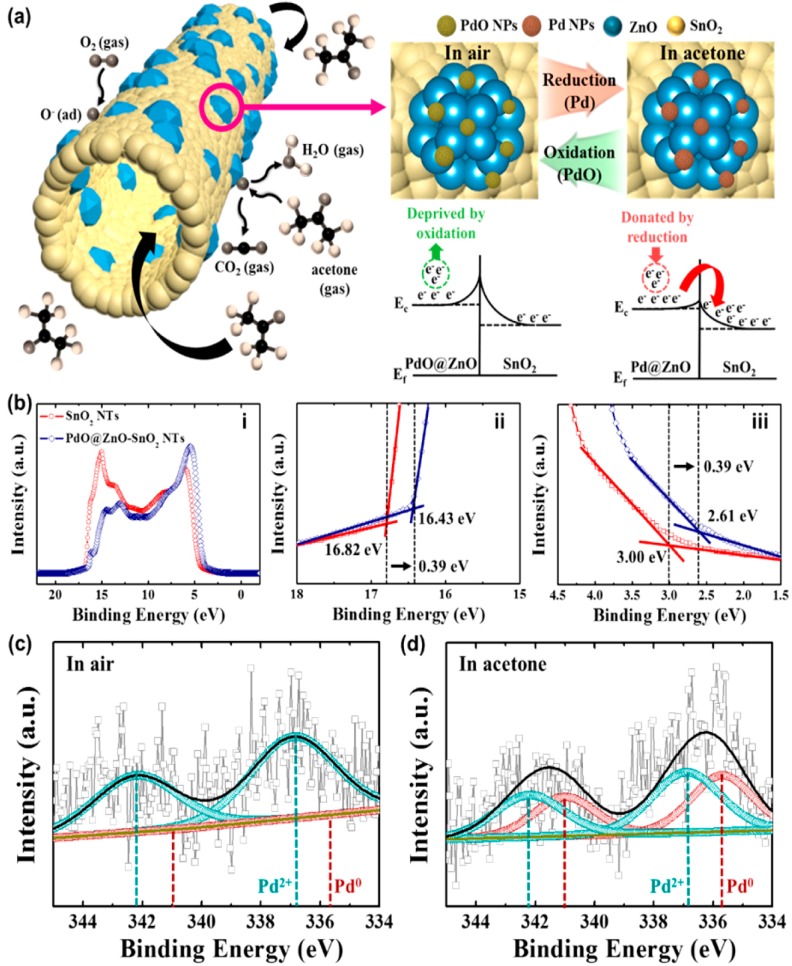
Figure 13.
(a) Schematic illustration of acetone-sensing mechanism for PdO@ZnO–SnO2 nanotubes NTs; (b) (i) ultraviolet photoelectron spectroscopy (UPS) spectrum of SnO2 NTs and PdO@ZnO–SnO2 NTs ((ii) high-binding-energy region and (iii) low-binding-energy region) and ex situ X-ray photoelectron spectroscopy (XPS) analysis using high-resolution spectra of PdO@ZnO–SnO2 NTs in the vicinity of Pd 3d (c) in air and (d) in acetone after a seven-cycle sensing measurement with 5 ppm of acetone at 400 °C. Adapted figure from [96] with permission from copyright (2017), American Chemical Society (Washington, DC, USA).

