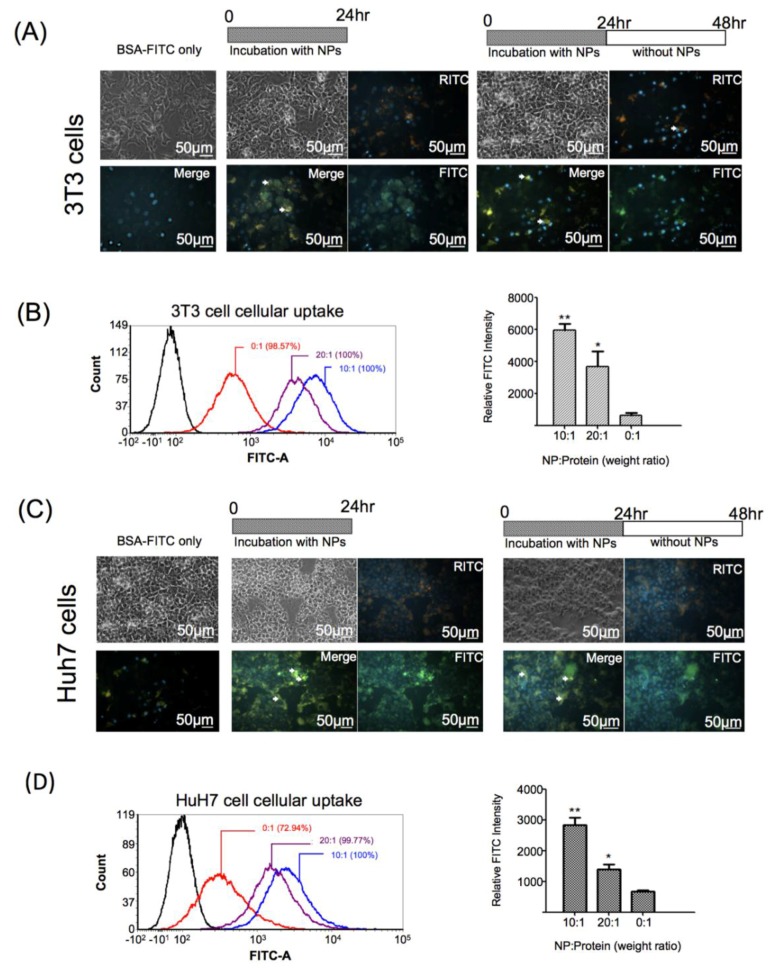
Figure 5.
Intracellular protein delivery by GR-PEI NPs. Fluorescent images of protein delivery by GR-PEI NPs in 3T3 fibroblast (A) and Huh7 cells (C) for 24 h and 24 h after treatment (Bar: 50 μm). The cells were incubated with BSA-FITC carried by GR-PEI NPs and free BSA-FITC (final protein concentration was 5 μg/mL). Different formulations of BSA-FITC loaded GR-PEI NPs and free BSA-FITC (final protein concentration was 2 μg/mL) were added to 3T3 fibroblast cells and Huh7 cells for 24 h. The protein delivery efficiency was evaluated by flow cytometry and quantified by measuring the geometric mean of FITC fluorescent intensity (B,D). The representative results are shown as M ± SD (n = 3). Each bar represents the means of three determinations ±SD. * p < 0.05, ** p < 0.01 among the indicated groups.

