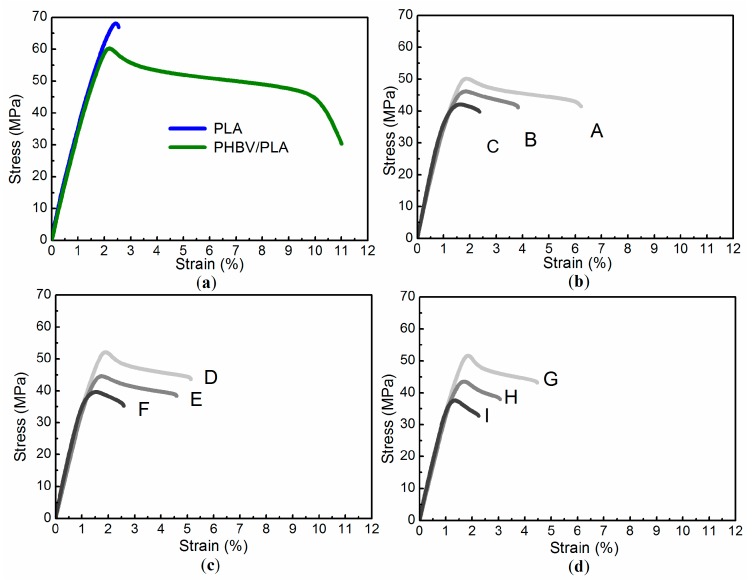
Figure 4.
Typical stress–strain curves of the cellulose/PHBV/PLA ternary composites, with that of PLA and PHBV/PLA as reference. Panel (a) describes stress–strain curves of PLA and PHBV/PLA. Panel (b) shows that of Sample A, B, and C, respectively. Panel (c) is that of Sample D, E, and F, respectively. Panel (d) describe that of Sample G, H, and I, respectively.

