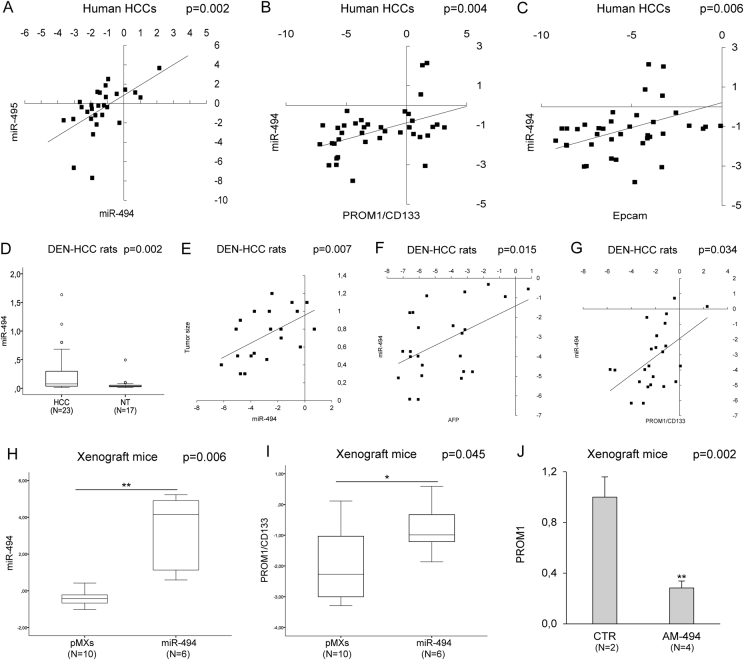
Fig. 1. MiR-494 is overexpressed in HCC and correlates with stem cell markers.
a Correlation graph between miR-494 and miR-495 expression levels in tumor tissue from 28 randomly selected HCC patients. Axes report 2−ΔΔCt values corresponding to miRNA levels (log2 form). b Correlation graph between miR-494 and PROM1 or c EPCAM mRNA levels in tumor samples from 38 HCC patients. Axes report 2−ΔΔCt values corresponding to miRNA and mRNA levels (log2 form). d Box plot graph of miR-494 expression in tumor (HCC) and non-tumor (NT) samples from the HCC rat model. y-axis reports 2−ΔΔCt values corresponding to miR-494 expression. e Correlation graph between tumor size and miR-494 levels in HCC animals. x-axis reports 2−ΔΔCt values corresponding to miR-494 levels transformed in a log2 form; y-axis represents tumor size (cm). f Correlation graph between miR-494 and AFP or g PROM1 mRNA levels in tumor samples from HCC rats. Axes report 2−ΔΔCt values corresponding to miRNA and mRNA levels (log2 form). h Box plot graph of miR-494 or i PROM1 levels in control (pMXs) and miR-494 overexpressing tumor masses from xenograft mice. y-axes report 2−ΔΔCt values corresponding to miR-494 or PROM1 expression (log2 form). j QPCR analysis of miR-494 expression in xenograft mice following antagomiR-494 treatment. CTR: vehicle control mice, AM-494: anti-miR-494 injected mice. y-axis reports 2−ΔΔCt values corresponding to miR-494 levels. a–j U6RNA and β-actin were used as housekeeping genes

