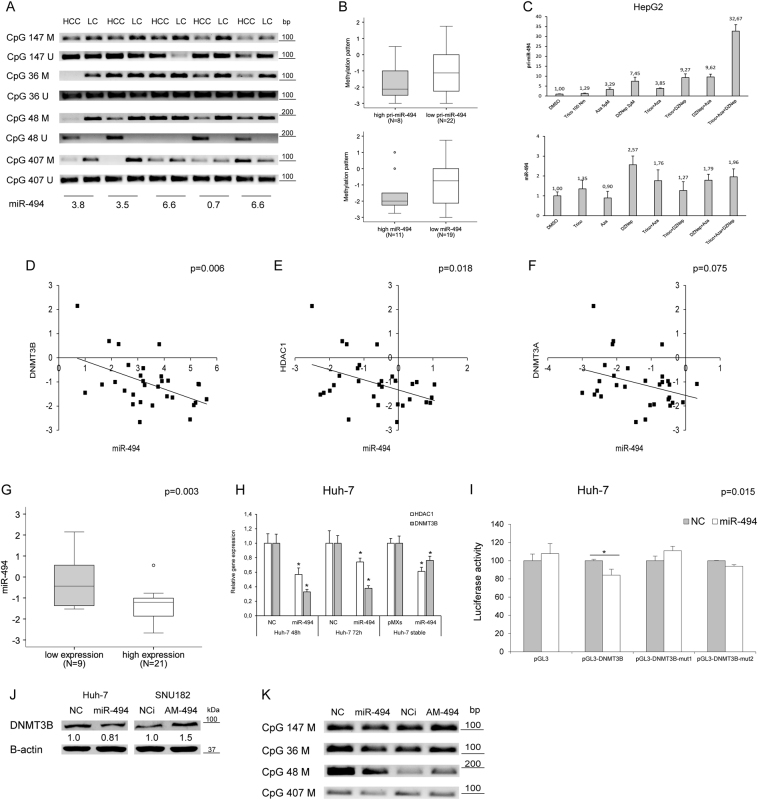
Fig. 2. Epigenetic regulation of miR-494 expression in HCC.
a MSP analysis of four CpG islands in tumor (HCC) and liver cirrhotic (LC) samples from 30 HCC patients. Primers for both methylated (M) and unmethylated (U) DNA regions have been used for each CpG island. MiR-494 levels are represented as the ratio between HCC and LC tissue. b Box plot graph of methylation status in HCC patients with high or low primary or mature miR-494 expression levels in tumor tissues with respect to matched non-tumor samples. A 1.3-fold-change has been considered as a cutoff to discriminate between high or low primary and mature miR-494 expression levels in HCC vs. matched LC tissues. A qualitative score was assigned to each CpG island based on its methylation status in the tumor vs. non-tumor sample. A mean value of the four CpG regions was considered for each patient. y-axis reports the methylation pattern, where negative and positive values are representative of a hypomethylated and hypermethylated status, respectively. c QPCR of primary (pri-miR-494) or mature miR-494 levels in HepG2 cells following epigenetic treatments. y-axis reports relative miR-494 or pri-miR-494 expression values with respect to vehicle (DMSO)-treated samples. d Correlation graphs between miR-494 and DNMT3B or e HDAC1 or f DNMT3A mRNAs in HCCs (N = 30). Axes report 2-ΔΔCt values corresponding to miRNA or mRNA levels (log2 form). g Box plot graph of miR-494 expression in HCC tumors divided on the basis of high or low HDAC1 and DNMT3B expression with respect to their median values. In particular, ‘‘low expression’’ includes samples with contemporaneous low HDAC1 and DNMT3B levels, whereas ‘‘high expression’’ groups all the other samples. y-axis reports 2-ΔΔCt values corresponding to miR-494 levels (log2 form). h QPCR analysis of HDAC1 or DNMT3B expression in transfected or infected Huh-7 cells. y-axis reports relative miR-494 values with respect to negative controls (NC or pMXs). i Luciferase reporter assay in Huh-7 cells co-transfected with pGL3-DNMT3B wild-type or mutated (mu1 and mut2) vectors and miR-494 or negative control (NC). j WB analysis of dnmt3b in miR-494 overexpressing or silenced HCC cells. β-actin was used to normalize QPCR and WB data. NC: pre-miR negative control, NCi: anti-miR negative control, AM-494: anti-miR-494. k MSP analysis of the four tested CpG islands in miR-494 overexpressing and silenced (AM-494) HepG2 cells. NC: pre-miR negative control, NCi: anti-miR negative control

