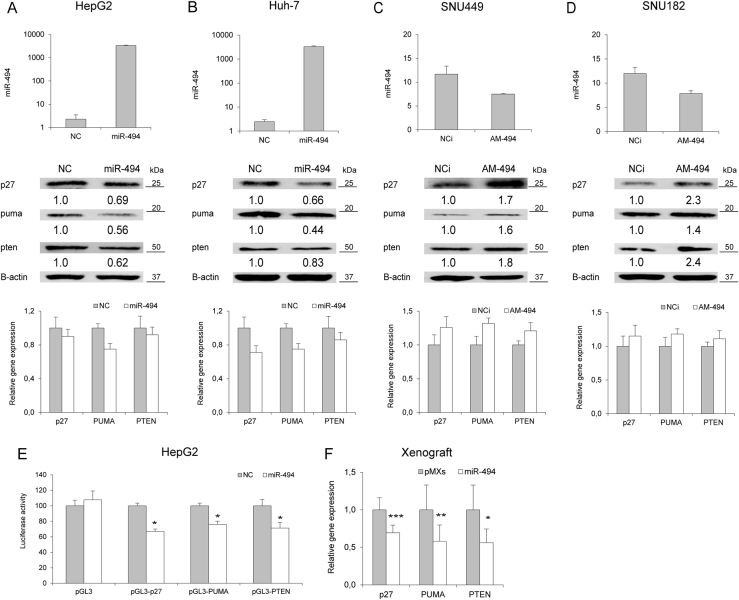
Fig. 3. MiR-494 targets CDKN2B, BBC3 and PTEN in HCC.
a QPCR and WB analyses of miR-494 and target genes in miR-494 overexpressing HepG2 and b Huh-7 cells. y-axes report 2-ΔΔCt values corresponding to miR-494 levels (top graphs) or relative gene expression levels (bottom graphs). c QPCR and WB analyses of miR-494 and target genes in miR-494 silenced SNU449, and d SNU182 cells. y-axes report 2-ΔΔCt values corresponding to miR-494 levels (top graphs) or relative gene expression levels (bottom graphs). e Luciferase reporter assay in HepG2 cells co-transfected with pGL3-3UTR vectors and miR-494 or negative control (NC). f QPCR analysis of miR-494 targets in the xenograft model. y-axis reports relative gene expression values. pGL3: empty reporter vector, NC: pre-miR negative control, NCi: anti-miR negative control, AM-494: anti-miR-494. β-actin was used to normalize qPCR and WB data

