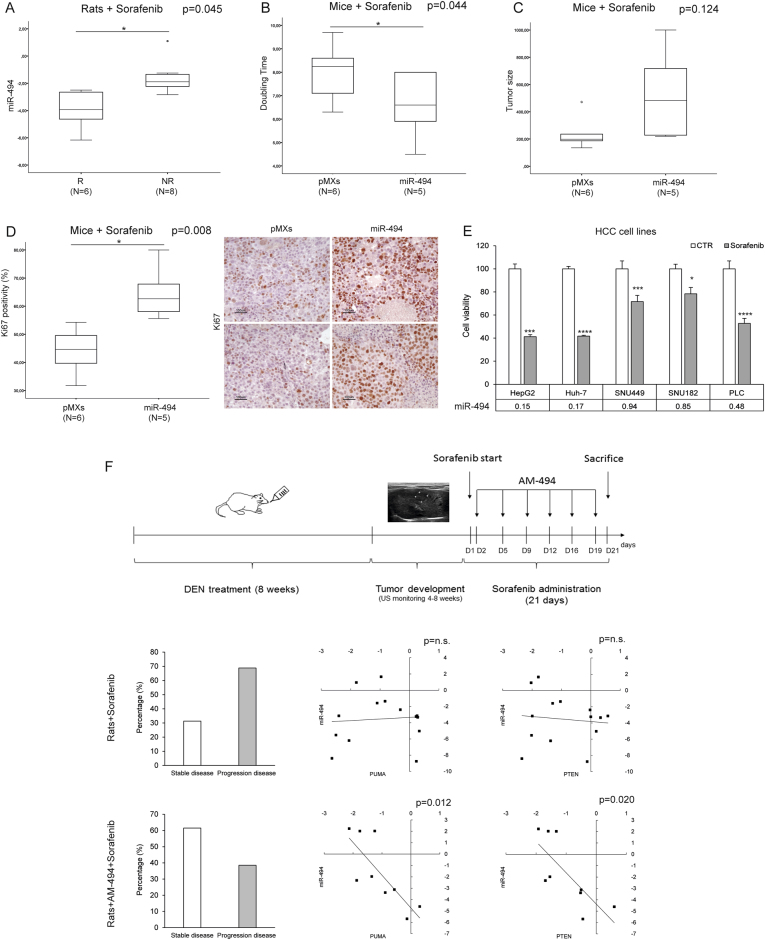
Fig. 7. MiR-494 increases sorafenib resistance in vivo.
a Box plot graph of miR-494 expression in responder (R) and non-responder nodules (NR) from Sorafenib treated HCC rats. y-axis reports 2-ΔΔCt values corresponding to miR-494 expression (log2 form). b Box plot graph of tumor doubling time or c size in Huh-7-derived xenografts. y-axes report tumor doubling time (days) or size (mm3), respectively. d Box plot graph of Ki67 positivity in Huh-7-derived xenografts. y-axis report tumor cell positivity (%). Representative IHC images (20X magnification) of Ki67 staining in control (pMXs) and miR-494 overexpresing Huh-7-derived xenograft masses. e Cell viability assay in HCC cells following sorafenib treatment (5.0 µM for 48 h). Columns represent cell viability relative (%) values with respect to vehicle (CTR)-treated cells. The experiment was executed twice in quadruplicate. MiR-494 basal expression levels (2−ΔΔCt) of each cell line are reported in table below the graph. f Panel graph of combined Sorafenib and AM-494 in vivo treatment in the DEN orthotopic rat model. In the top part of the panel graph is illustrated the experimental protocol. When US-monitoring identified a 2–3 mm nodule we started with animal treatments, considering as day 1 (D1) the first day of sorafenib administration. Two AM-494 injections were performed weekly starting from the second day (D2). In the bottom part are illustrated percentage graphs representing treatment efficacy together with correlation graphs between miR-494 and PUMA or PTEN mRNA levels in tumor samples from sorafenib-only and anti-miR-494-sorafenib treated animals. Axes report 2−ΔΔCt values corresponding to miRNA and mRNA levels (log2 form). AM-494: anti-miR-494

