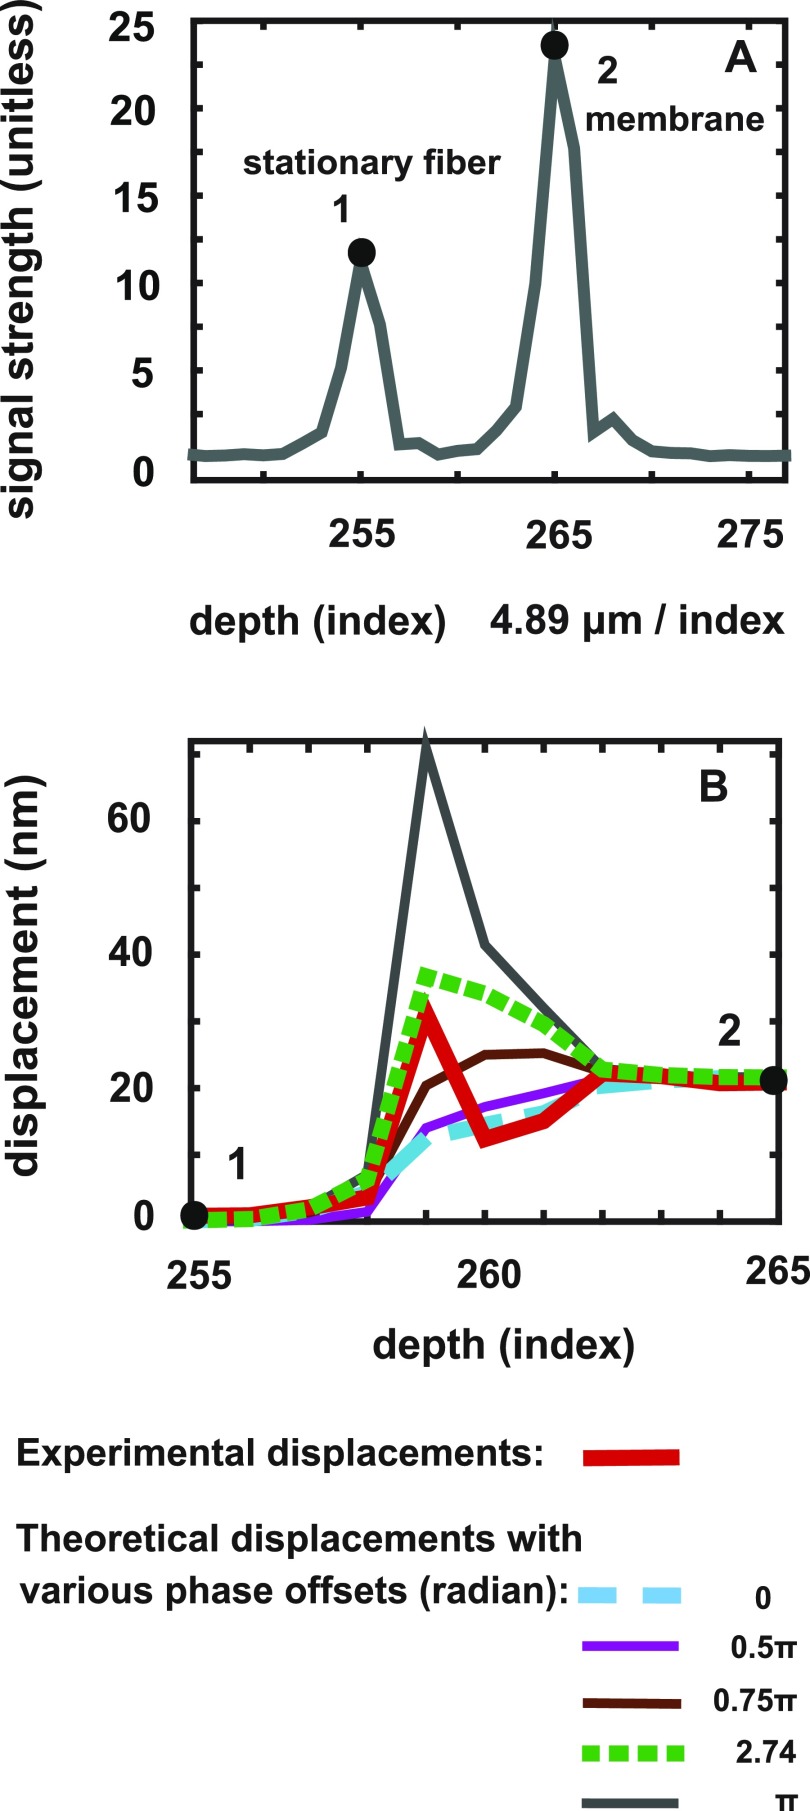
FIG. 4.
(Color online) Responses of the membrane/fiber sample when driven with a 7008 Hz pure tone of a level that resulted in a ∼20 nm vibration of the membrane and no discernible vibration of the fiber. (A) A-scan indicating points 1 and 2 of the stationary fiber and membrane, respectively. (B) Thick red curve: reported response amplitudes at points 1 and 2 and all points in between. (Responses were not distorted, thus waveforms are not shown.) Other curves: theoretical reported displacements when accounting for phase leakage. The calculation used the A-scan and vibration results from the fiber and membrane. Several ΔΘAB0 values were used to illustrate the sensitivity of the phase leakage prediction to this value.

