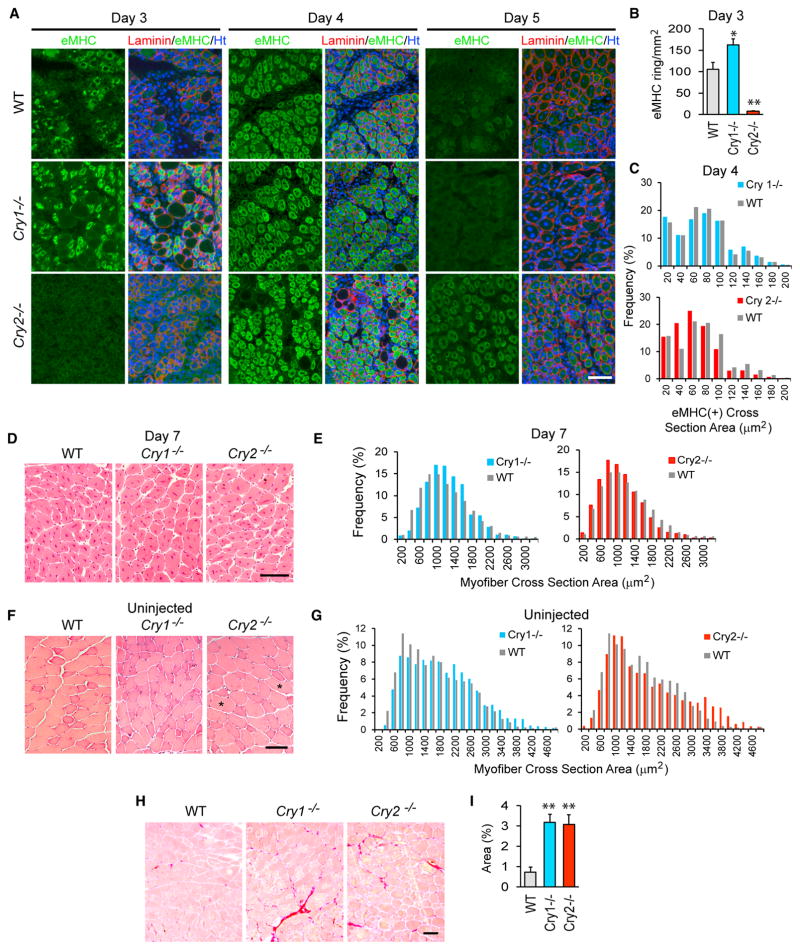
Figure 1. Regeneration of TA Muscle in Cry1−/− and Cry2−/− Mice.
(A) Immunofluorescence staining of TA muscle with eMHC antibody on days 3, 4, and 5 after injection with barium chloride. Laminin staining defines the border of each myofiber. DNA was counterstained with Hoechst 33342. TA muscles were damaged and harvested between 10 a.m. and 2 p.m. (zeitgeber time 4 [ZT4] and ZT8), when Cry1 and Cry2 mRNA levels were low (Figure 4C). This was because the peak timing of these mRNA levels was variable among WT, Cry1−/−, and Cry2−/− mice, leaving the lower expression level timing more consistent.
(B) The frequency of myofibers with eMHC staining in a ring shape in regenerating myofibers, identified by ring-shaped laminin staining on day 3. In undamaged myofibers, eMHC was not expressed, and laminin staining displayed polygonal shapes. eMHC staining was defined as a ring shape with an unstained area in the center, corresponding to a centrally located nucleus, with a diameter larger than 10 μm. Muscle areas of 5 mm2 were observed in each mouse, and two mice were used for each strain.
(C) Size distribution of eMHC(+) myofiber cross-sections on day 4. We measured 2,000 myofibers from two mice, totaling 4,000 myofibers for each strain. Chi-square analysis indicates that Cry1−/− myofibers were larger and that Cry2−/− myofibers were smaller than those of the WT, with p < 0.01. Average sizes of myofiber cross-section areas are as follows: WT, 66.2 μm2; Cry1−/− 68.4 μm2; and Cry2−/− 55.7 μm2.
(D) H&E staining of day 7 TA sections.
(E) Size distribution of the H&E-stained myofiber cross-sections on day 7. 500 randomly selected myofibers from four mice, totaling 2,000 myofibers for each mouse strain, were measured. Chi-square analysis indicates that Cry1−/− myofibers were larger and that Cry2−/− myofibers were smaller than WT myofibers, with p < 0.01. Average sizes of myofiber cross-section areas are as follows: WT, 1,111.7 μm2; Cry1−/− 1,136.4 μm2; and Cry2−/−, 1,018.2 μm2.
(F) H&E staining of uninjected TA sections. Unusually large myofibers are marked with asterisks.
(G) Size distribution of the cross-sections of uninjected myofibers. Two thousand myofibers for each mouse strain were measured as described in (E). Cry1−/− myofibers were larger than WT myofibers, with p < 0.01 from Chi-square analysis. Average sizes of myofibers are as follows: WT, 1,580.4 μm2; Cry1−/−, 1,815.0 μm2; and Cry2−/−, 1,789.6 μm2.
(H) Sirius red staining of uninjected TA muscles isolated from 10-week-old mice.
(I) Area percentage of fibrosis, indicated by positive Sirius red staining in (H).
*p < 0.05 and **p < 0.01 with Student’s t test. Data are presented as mean + SD in (B) and (I). Scale bars, 100 μm.

