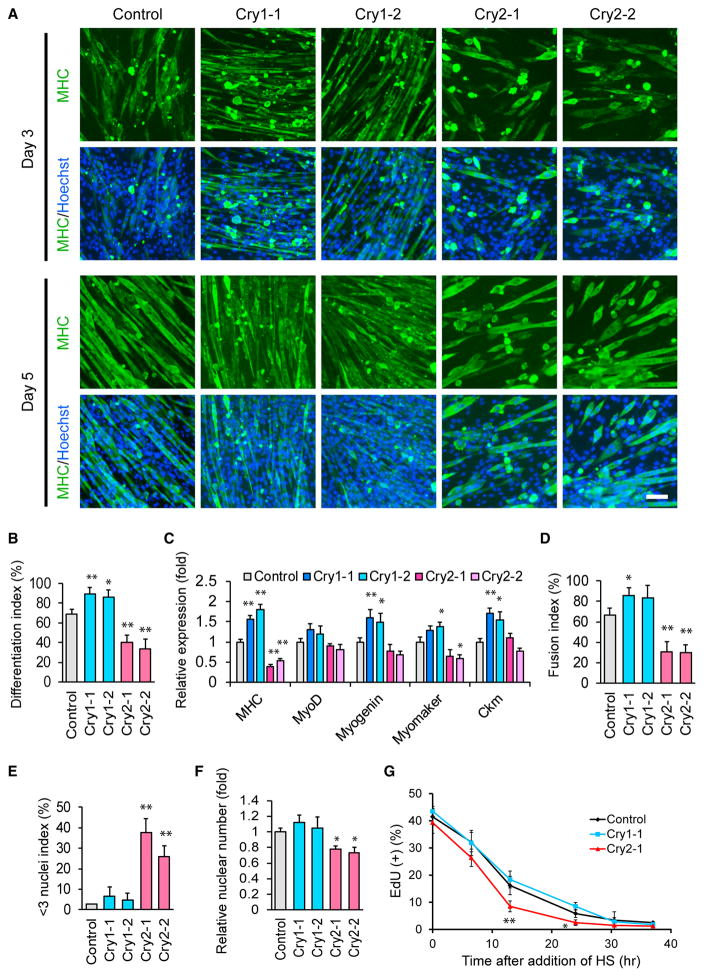
Figure 3. Differentiation of C2C12 Cells after KD of Cry1 and Cry2.
(A) MHC staining of C2C12 KD cells during differentiation. Two shRNA clones each were used for Cry1 and Cry2 KD. Scale bar, 100 μm.
(B) Differentiation index on day 5, obtained from the observation of 1,000 nuclei.
(C) Relative expression levels of five muscle genes determined by qPCR on day 5. The value obtained with control cells was defined as 1.0.
(D and E) Fusion index (D) and < 3 nuclei index (E) of KD cells on day 5, obtained from the observation of 1,000 nuclei.
(F) Relative nuclear number of KD cells on day 5. The number of control nuclei was defined as 1.0. The results were calculated by counting nuclei in four different fields with a 20× lens.
(G) Temporal profile of the frequency of EdU(+) nuclei in KD cells after induction of differentiation. The results were obtained by counting 1,000 nuclei.
Data are presented as mean + or ± SD.

