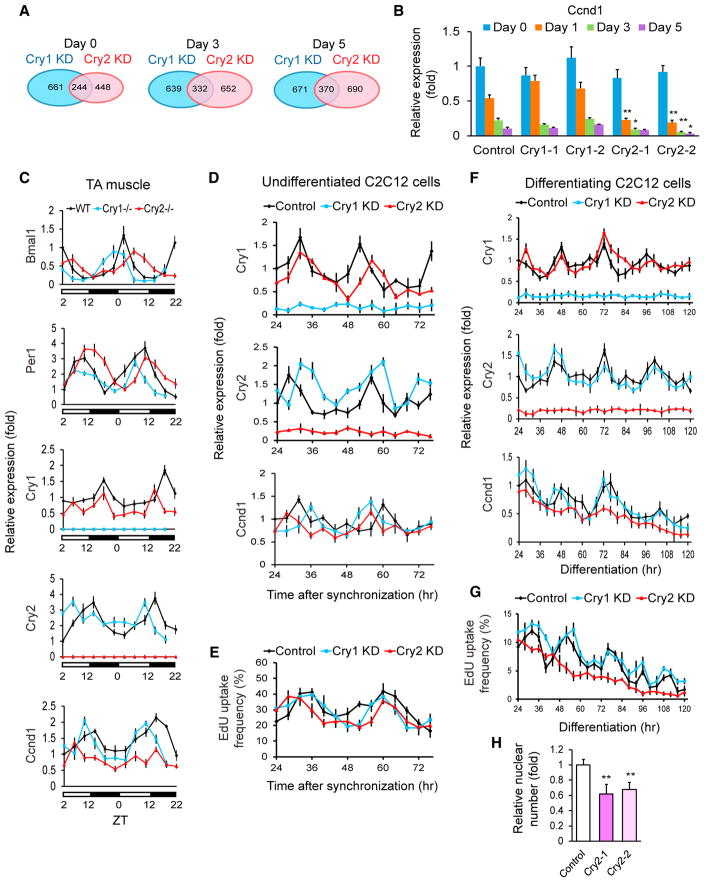
Figure 4. Gene Expression Analyses of KD C2C12 Cells.
(A) Venn diagrams displaying the number of genes whose expression levels were > 200% or < 50% of those of control cells. shRNA clone 1 was used for Cry1 and Cry2 KD.
(B) qPCR results comparing the expression levels of Ccnd1 during differentiation of KD cells. The value obtained with the control on day 0 was defined as 1.0.
(C) Temporal profiles of the indicated gene levels in the TA muscles of KO mice. WT expression values at ZT2 on the first day in the graph were defined as 1.0. The light was on between ZT0 and ZT12.
(D) Temporal profiles of indicated gene levels in undifferentiated KD cells after synchronization with forskolin between −1 and 0 hr. The control value at 24 hr was defined as 1.0. shRNA clone 1 was used for Cry1 and Cry2 KD. Cell harvest was initiated 24 hr after forskolin treatment to wait for recovery from its acute effects.
(E) Temporal profile of EdU uptake in undifferentiated and synchronized C2C12 cells. The results were obtained by counting 1,000 nuclei.
(F) Temporal profiles of the indicated gene levels in differentiating KD cells after synchronization with forskolin between −1 and 0 hr. The control value at 24 hr was defined as 1.0 for each gene.
(G) Temporal profile of EdU uptake during differentiation of synchronized KD cells.
(H) Relative nuclear number of KD cells 120 hr after differentiation. The number in control cells was defined as 1.0.
Data are presented as mean + or ± SD.

