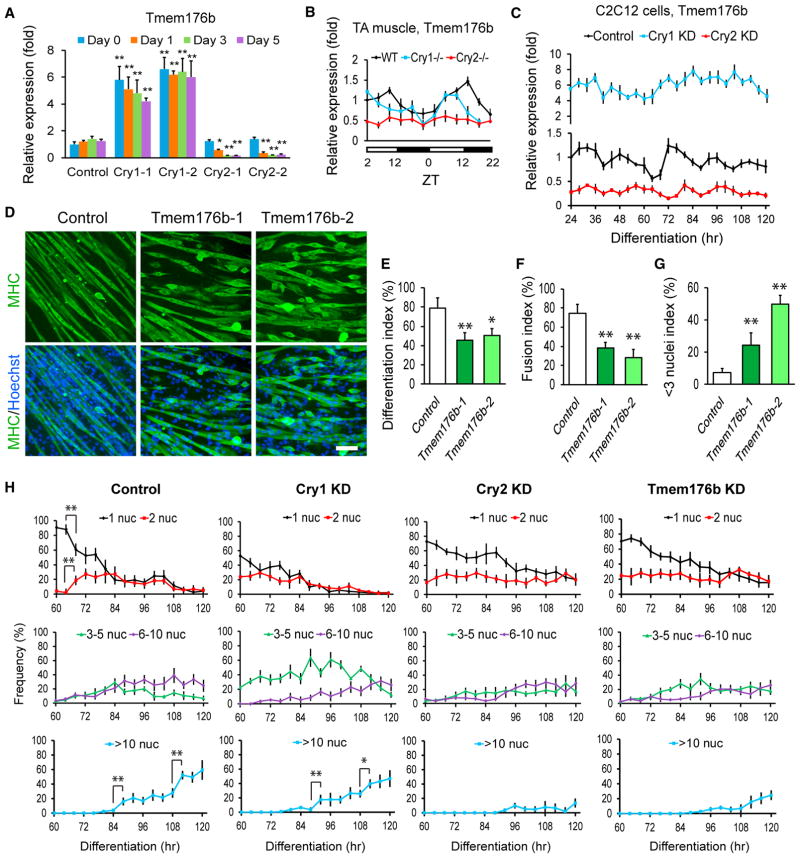
Figure 5. Inhibition of Cell Fusion with Tmem176b KD in C2C12 Cells.
(A) qPCR comparing the expression levels of Tmem176b during differentiation of Cry1 and Cry2 KD cells. Two shRNA clones were used for each gene. The expression level of Tmem176b in day 0 control cells was defined as 1.0.
(B) Temporal profiles of Tmem176b expression levels in WT, Cry1−/−, and Cry2−/− TA muscles.
(C) Temporal profiles of Tmem176b expression levels in C2C12 cells synchronized with forskolin between −1 and 0 hr and induced to differentiate at 0 hr. shRNA clone 1 was used for Cry1 and Cry2 KD.
(D) MHC staining of Tmem176b KD cells on differentiation day 5. Scale bar, 100 μm.
(E–G) Differentiation index (E), fusion index (F), and < 3 nuclei index (G) of Tmem176b KD cells on day 5.
(H) Frequency of nuclei in MHC(+) cells containing 1, 2, 3–5, 6–10, and more than 10 nuclei within one cell during differentiation. A total of 1,000 nuclei were counted at each time point.
Data are presented as mean + or ± SD.

