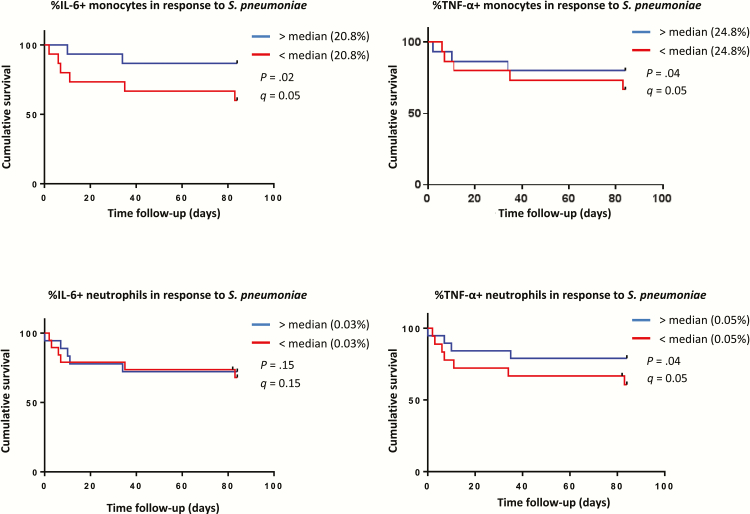
Figure 3.
Time to death and innate responses to Streptococcus pneumonia. Kaplan-Meier curves for the survival analysis of monocyte (n = 31) and neutrophil (n = 37) production of interleukin-6 and tumor necrosis factor-ɑ in response to S. pneumoniae are shown. The population of patients with human immunodeficiency virus–associated tuberculosis was split at the median for each respective analysis. Blue lines are for the group with cytokine production above the median; in red, the patients who had responses below the median. Abbreviations: IL, interleukin; TNF, tumour necrosis factor.

