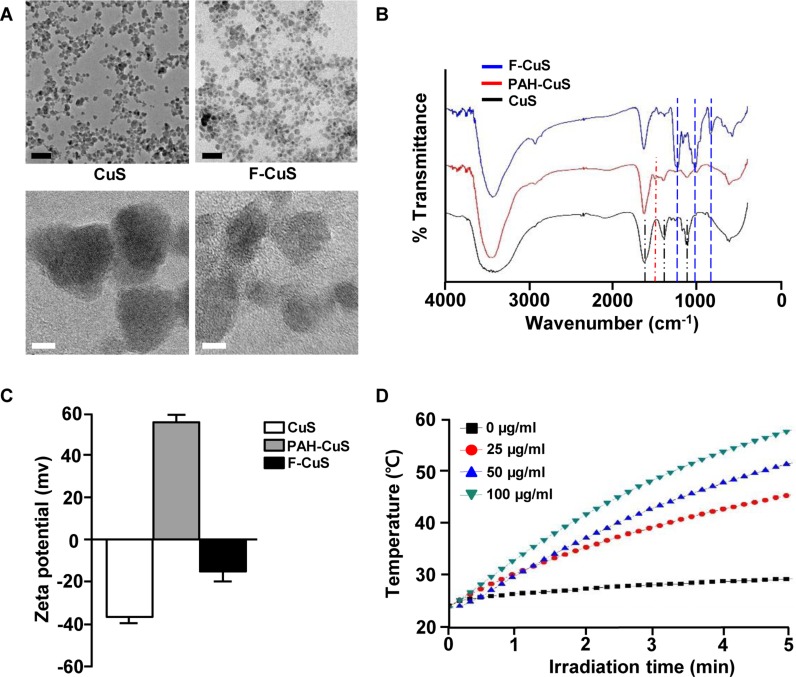
Figure 2. Characterization of F-CuS.
(A) FE-TEM images of CuS and F-CuS. Scale bars: 50 nm (black) and 5 nm (white). (B) FT-IR spectra of CuS (black), PAH-CuS (red), and F-CuS (blue). (C) Zeta potential value of each NP. (D) Photothermal heating curves of different concentrations of F-CuS dispersed in water, irradiated for 5 min with an 808 nm laser at a power density of 2 W/cm2.

