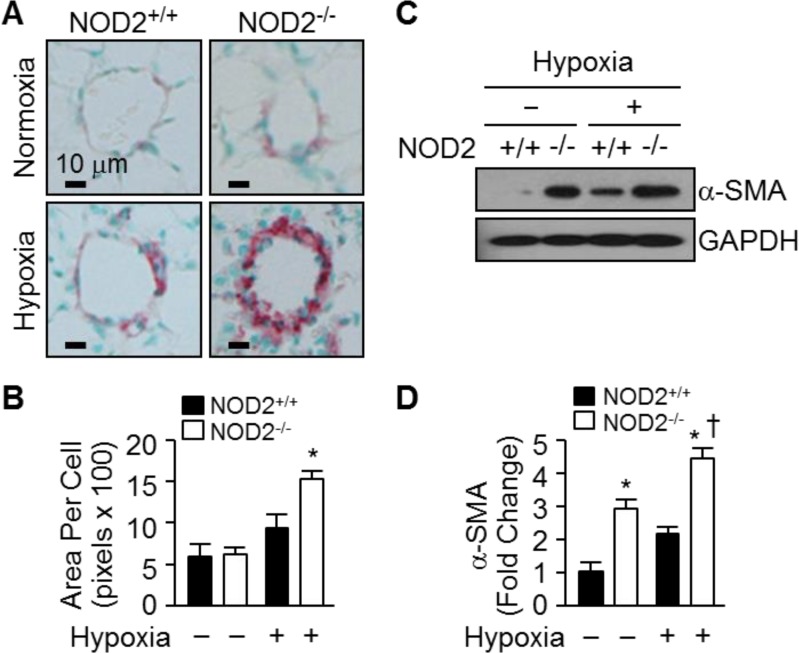
Figure 4. NOD2−/− mice exhibit enhanced hypertrophy of PASMCs after hypoxia.
(A) α-SMA immunostaining of the lungs of NOD2+/+ (left) and NOD2−/− (right) mice after exposure to normoxic (top) or hypoxic (bottom) conditions for two weeks. (B) Quantification of PASMC size in NOD2+/+ (black bars) and NOD2−/− (white bars) mice. Ten vessels per mouse were analyzed after exposure to normoxic (n = 5 per group) or hypoxic (n = 8 per group) conditions for two weeks. Data are expressed as means ± SDs; *P < 0.05 for hypoxic NOD2−/− mice vs. hypoxic NOD2+/+ mice. (C) Western blot analysis of α-SMA levels in the lungs of NOD2+/+ and NOD2−/− mice after two weeks of exposure to hypoxic or normoxic conditions. GAPDH was used as control for normalization. The experiment was conducted three times, and the images depict representative results. (D) Normalized α-SMA levels represented graphically. *P < 0.05 for hypoxic mice vs. normoxic controls; † P < 0.05 for hypoxic NOD2−/− mice vs. hypoxic NOD2+/+ mice.

