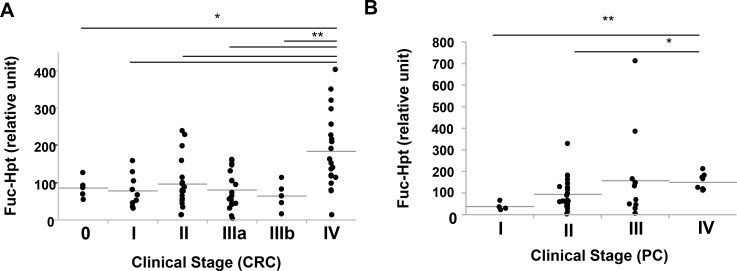
Figure 7. Relationship of clinical stage and serum Fuc-Hpt levels determined with new ELISA system, using 10-7G mAb.
Serum Fuc-Hpt levels were plotted in terms of clinical stage of colorectal cancer (CRC) (A) and pancreatic cancer (PC) (B). Horizontal grey lines indicate the mean values of Fuc-Hpt in each group. *P < 0.05. **P < 0.01.

