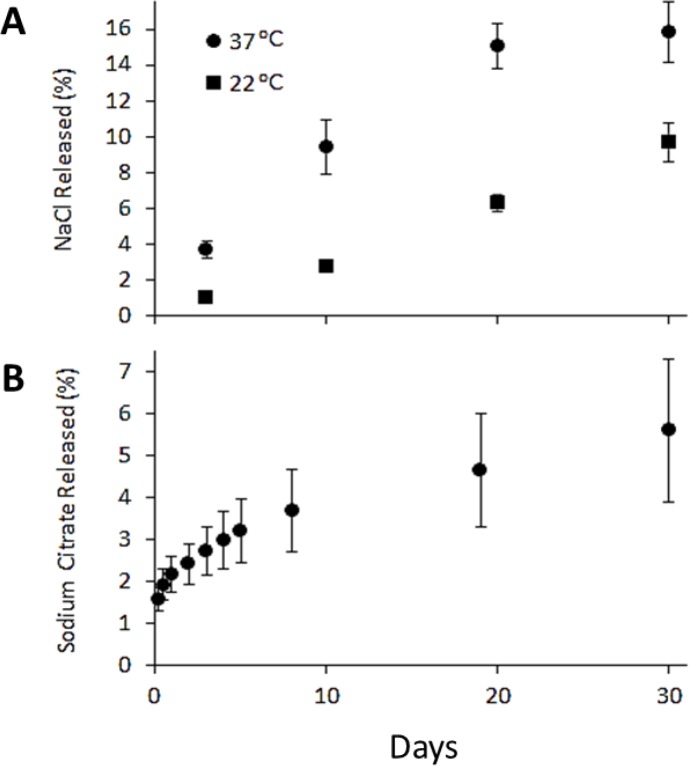
Figure 3. Release profiles.
(A) Sodium chloride at 22 and 37° C over 30 day period to simulate ambient and physiological conditions, respectively. Results are given for solute release as a percent of initial loading of solute in the emulsion. (B) Sodium citrate over 30 day period as a percent of initial loading of solute in the emulsion.

