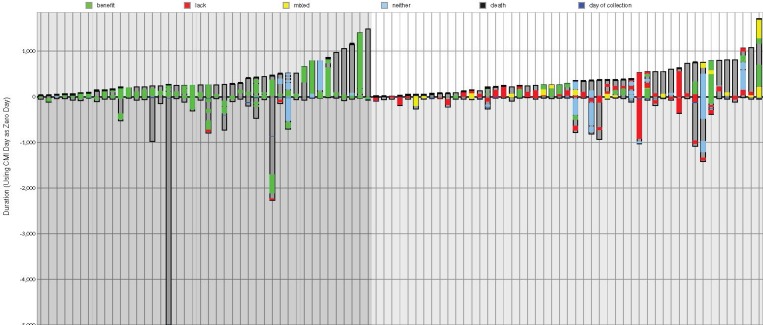
Figure 2. Patients' treatment schedules and outcomes.
Treatment plans for the 42 matched patients shown in ascending post-profiling survival time are shown on the left (darker background), and for the 49 unmatched patients are on the right (lighter background). The ordinate is time in days where the axis is the time of profiling. Gray = total time monitored from diagnosis; a black line at the top of a column is death; green = time on a drug of benefit; red = lack of benefit treatment; yellow = combination therapy including benefit and lack of benefit drugs; blue = neutral therapy (neither benefit nor lack of benefit).

