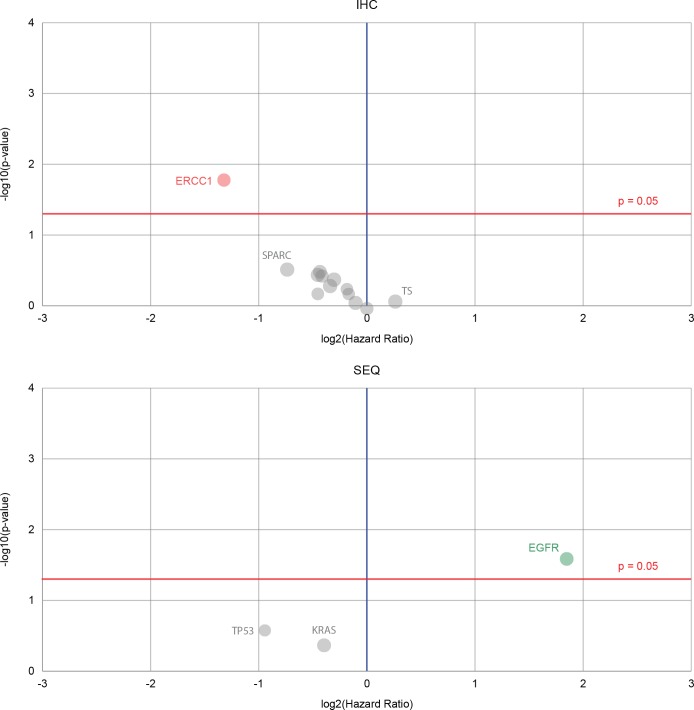
Figure 3. Volcano plots that show biomarkers’ prognostic value for a lung cancer dataset.
Red dots indicate the hazard rate of a positive biomarker result is significantly higher than that of a negative biomarker result, green shows that the hazard rate of a positive biomarker result is significantly lower than that of a negative biomarker result, gray shows that the difference between a positive and negative result is not significant. Immunohistochemistry biomarkers with the notable DNA excision repair protein ERCC1 are shown in the upper plot. Biomarkers derived from sequencing are displayed in the lower plot, and although there are only three sequencing markers, the epidermal growth factor receptor (EGFR) shows good prognostic ability.

