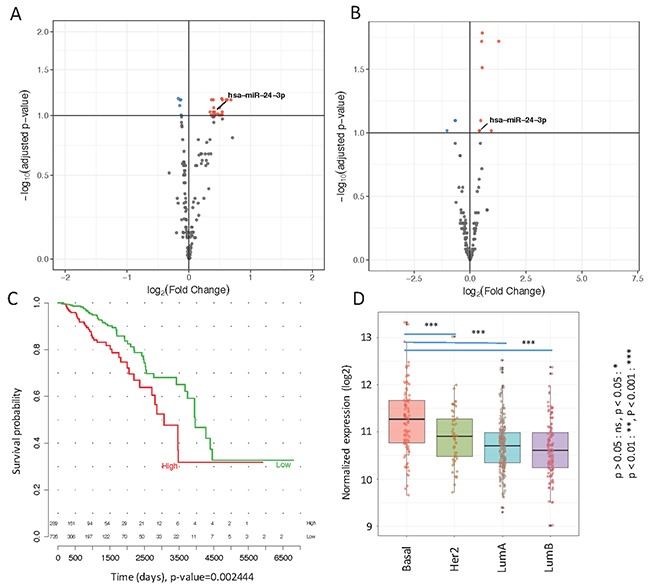
Figure 1.

(A) Volcano plot of differentially expressed miRNAs in metastatic and non-metastatic serum samples obtained by Nanostring data analysis. Upregulated miRNAs are plotted in red and downregulated in blue (B) Volcano plot of differentially expressed miRNAs in TCGA stage I versus stage IV primary tumor samples. Upregulated miRNAs in Stage IV are plotted in red and downregulated in blue (C) Survival curve of mir-24-3p in TCGA patients (D). Distribution of mir-24-3p across different tumor subtypes in TCGA primary tumors.
