
Figure 4.
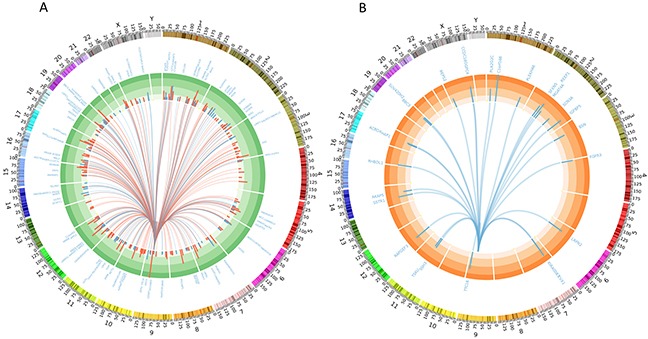
Circos plots depicting (A) 316 deferentially expressed genes (FDR < 0.1) out of 745 target genes detected by TargetScan for mir-24-3p (differentially expressed in patients with high mir-24-3p levels vs. low miR-24). Red arcs show genes upregulated and blue downregulated in samples with high mir-24-3p and the histogram represents the fold change. (B) 27 significantly down regulated genes (FDR < 0.1 & fold change > 2) out of 745 target genes detected by TargetScan for mir-24-3p showing the most possible targets.