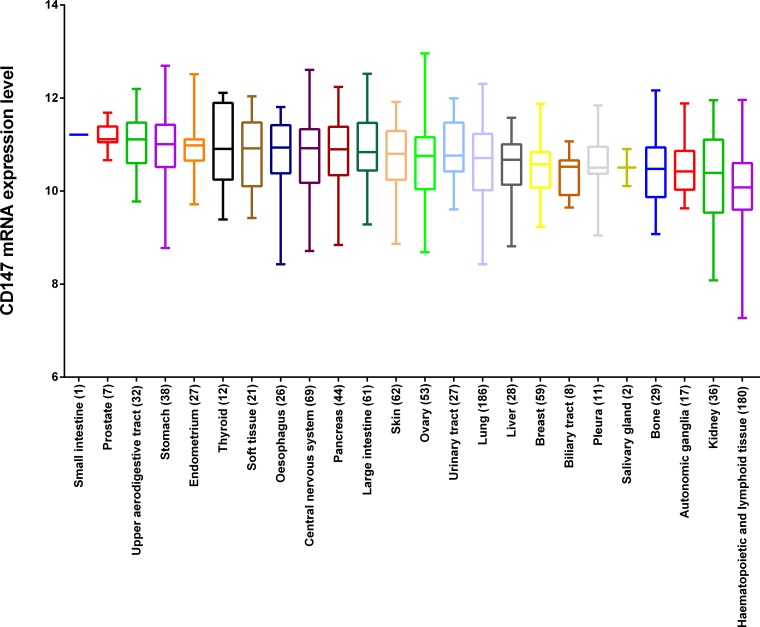
Figure 1. The mRNA expression profile of CD147 in the CCLE panel.
The expression values were obtained with Affymetrix U133+2 arrays. Quality filtering and normalization were performed using Robust Multi-array Average (RMA) and quantile normalization. The number in the brackets is the number of cell lines originated from the corresponding tissue.

