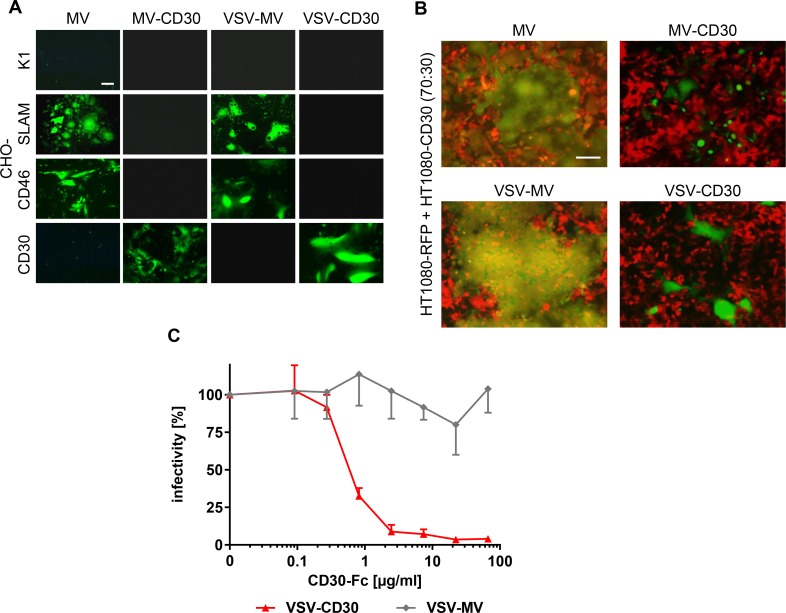
Figure 2. Receptor usage of MV-CD30 and VSV-CD30.
(A) CHO-cells stably expressing SLAM, CD46 or CD30 were infected with CD30-targeted viruses or untargeted parental viruses at an MOI of 1 and analyzed by fluorescence microscopy 24 h (VSV-MV, VSV-CD30) or 72 h (MV, MV-CD30) post infection, respectively. Scale bar = 200 μm. (B) HT1080-RFP and HT1080-CD30 were co-cultured at a ratio of 70:30 and infected with CD30-targeted viruses or untargeted parental viruses at an MOI of 1 and analyzed by fluorescence microscopy 24 h (VSV-MV, VSV-CD30) or 72 h (MV, MV-CD30) post infection, respectively. An overlay of red and green fluorescence is shown. Scale bar = 200 μm. (C) VSV-MV and VSV-CD30 were pre-incubated for 30 min with increasing amounts of CD30-Fc protein. Subsequently, HT1080-CD30 cells were inoculated and the percentages of infected cells were determined 72 h later. Relative infectivities were calculated by normalizing the values to mock treated controls. n = 3, error bars: mean ± SD.

