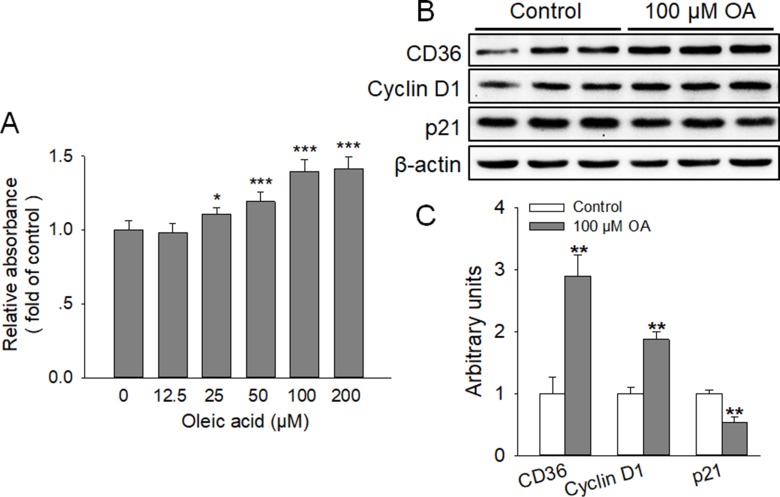
Figure 1. OA enhanced the proliferation of HC11 and the expression of CD36.
(A) Effect of various concentrations of OA (0, 12.5, 25, 50, 100, and 200 μM) on the proliferation of HC11 after a 4-day culture was determined by MTT analysis. (B) Western blot analysis of proliferative markers (Cyclin D1 and p21) and CD36 in HC11 after a 4-day culture. β-actin was used as the loading control. (C) Mean ± SEM of immunoblotting bands of CD36, Cyclin D1 and p21, and the intensities of the bands were expressed as the arbitrary units. *P < 0.05, **P < 0.01 and ***P < 0.001 versus the 0 μM OA (Control) group.

