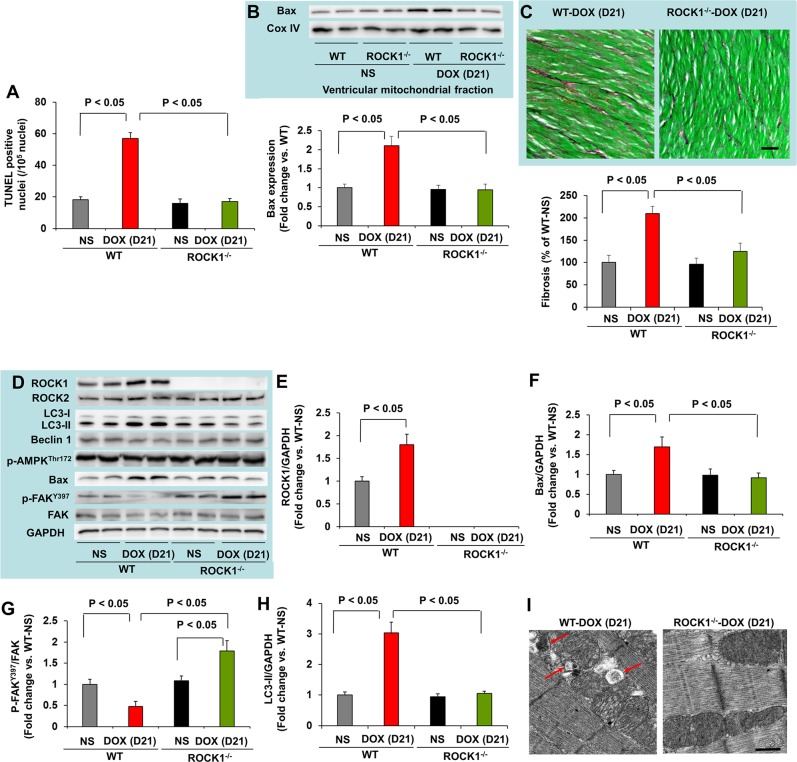
Figure 3. ROCK1 deletion inhibited doxorubicin-induced apoptosis, fibrosis and autophagy.
(A). Quantification of total TUNEL positive nuclei per 105 total nuclei in ventricular myocardium from WT and ROCK1 deficient hearts on day 21 after the initial injection. N = 4-6 in each group. (B). Representative images (top) of Western blot analysis of Bax and Cox IV in mitochondrial fraction of ventricular homogenates from WT and ROCK1 deficient hearts. Quantitative analysis (bottom) of immunoreactive bands of Bax (N = 4-6 in each group) expressed as fold change relative to NS-treated WT group. (C). Representative heart sections (top) stained with picrosirius red/Fast green (scale bar, 50 μm) showing collagen deposition. Quantitative analysis (bottom) of the collagen deposition in WT and ROCK1 deficient hearts, expressed as percentage change relative to NS-treated WT hearts. Four to six hearts in each group. At least 10 randomly chosen high power fields per section and four transverse sections from each heart, sampled from the midpoint between the apex and base, were analyzed. (D). Representative images of Western blot analysis of ROCK1, ROCK2, LC3, Beclin 1, p-AMPK-Thr172, Bax, FAK and p-FAK-Tyr397 in ventricular homogenates of WT and ROCK1 deficient hearts on day 21 after the initial injection. (E-H) Quantitative analysis of immunoreactive bands of ROCK1 (E), Bax (F), p-FAK-Tyr397/FAK (G) and LC3-II (H). N = 4-6 in each group. (I). Representative transmission electron microscopy images of WT and ROCK1 deficient hearts on day 21 after the initial injection. DOX-treated WT heart showed increased numbers of autophagic vacuoles (red arrows). Scale bar, 0.5 μm.

