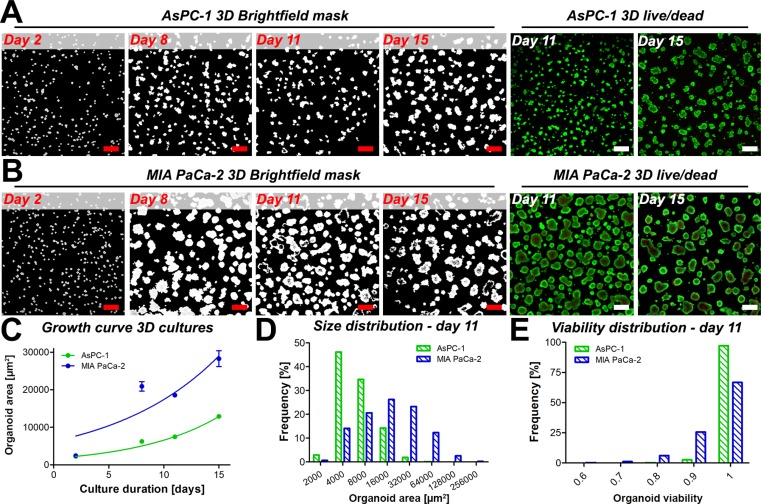
Figure 1.
Masked brightfield images illustrate the overall size and spacing of the tumor organoids of AsPC-1 (A) and MIA PaCa-2 (B) cultures. Cultures were stained for live (calcein AM, green) and dead (PI, red) cells to reveal the presence of necrotic cores in the 3D cultures (live/dead panels) in absence of treatment on days 11 and 15. Scalebar = 400 μm. (C) Growth of AsPC-1 (green) and MIA PaCa-2 (blue) organoids (mean ± 95% CI, N = 3000–8000). (D) Size distributions of individual AsPC-1 (green) and MIA PaCa-2 (red) organoids on day 11, in μm2. (E) Distributions of organoid viability of AsPC-1 organoids (green) and MIA PaCa-2 organoids (blue) on culture day 11.

