. 2017 Sep 12;8(11):7675–7681. doi: 10.1039/c7sc03217j

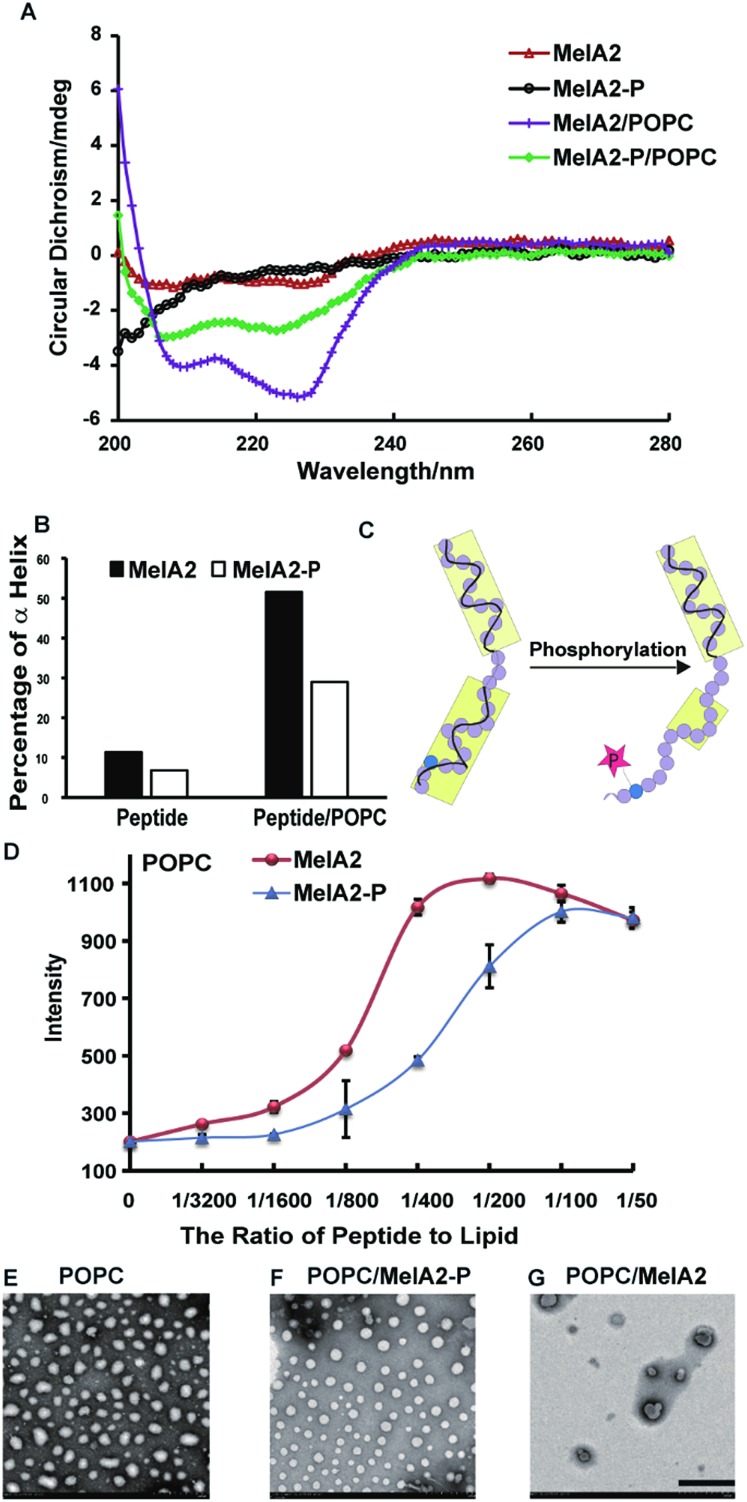
Fig. 1. Phosphorylation on Thr23 of MelA2 impairs the α helix conformation and membrane lysis capacity. (A) CD spectra of MelA2 and MelA2-P. Peptides (10 μM) were incubated with empty POPC vesicles at a peptide-to-lipid ratio of 1 : 50 for 1.5 h before the CD measurements. (B) The percentage of the α helix conformation in MelA2 and MelA2-P. The secondary structures of the peptides were measured by CD and the percentages of α helix were quantified by CDNN software. (C) The scheme of the conformation change of MelA2 and MelA2-P. Phosphorylation on Thr23 impaired the α helix structure in the C terminus of MelA2. (D) Calcein leakage from POPC after treatment with MelA2-P and MelA2. Different doses of peptides were incubated with 100 μM (lipid concentration) calcein trapped POPC at a peptide-to-lipid ratio from 1/3200 to 1/50 for 20 min. The leakage amount reached a plateau before 20 min and the calcein fluorescence at the plateau was used as the final intensity, with n = 3. (E–G) TEM images of native POPC, POPC treated with MelA2-P and MelA2. For TEM, peptides (10 μM) were incubated with empty POPC vesicles at a peptide-to-lipid ratio of 1 : 50 for 10 h. The scale bar in the TEM images is 500 nm.

Fig. 1