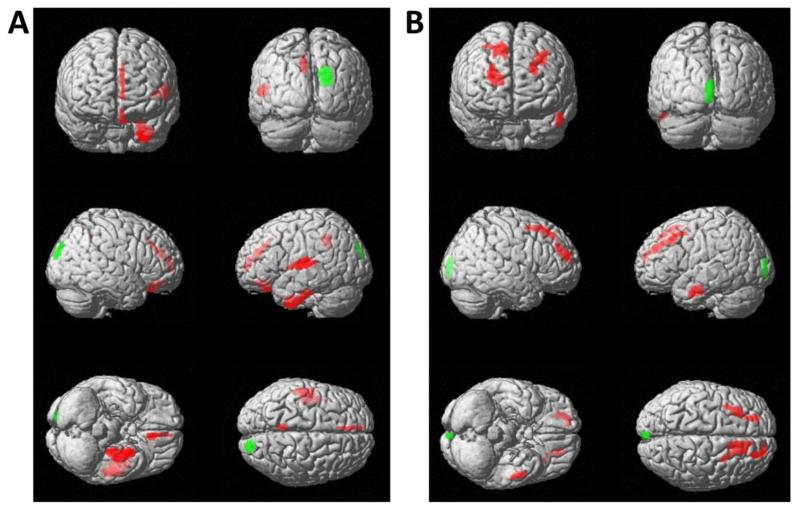
Figure 2.
Results of statistical parametric mapping (SPM) for [18F]-AV45-PET (A) and FDG-PET (B) in Aß(+) subjects, corrected for MMSE scores, age, gender, APO-ε allelic status and years of education. Subsyndromally depressed subjects (DEP; N=65) were contrasted against NON-DEP (N=141) subjects. Voxels exceeding a significance threshold of p < 0.005, (unc.; k > 100 voxel) for increased amyloid levels or FDG hypermetabolism in depressed subjects are indicated in red, while voxels of decreased amyloid levels or FDG hypometabolism in subjects with depressive symptoms are indicated in green. Both contrasts are rendered on the surface of the standard SPM8 template.

