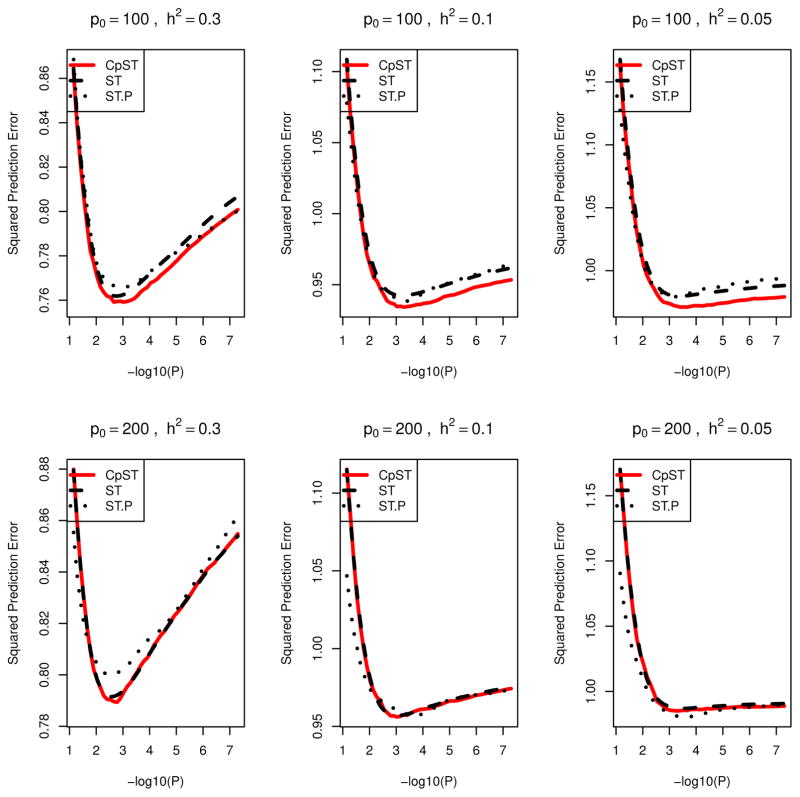
Figure 2.
Prediction errors averaged over 20 simulation replicates for quantitative traits in polygenic scenarios (Models P1,...,P6). Black dashed line (ST), average of mean prediction squared error for training data (PSEtr) for predictive models from smooth-threshold multivariate genetic prediction at each p-value threshold in minus log10-scale (x-axis). Black dotted line (ST.P), average of prediction squared error for test data (PSEte) for predictive model from smooth-threshold multivariate genetic prediction trained on the training data. Red solid line (CpST), average of the proposed Cp-type criterion (an unbiased estimator of the black dashed line).

