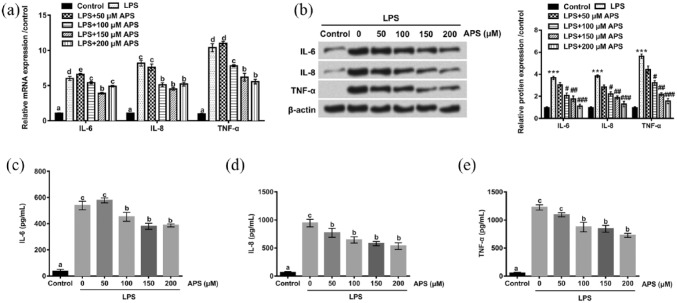
Figure 3.
Effects of APS on LPS-induced the expression and release of inflammatory cytokines in H9c2 cells. (a)–(b) The mRNA and protein expression levels of IL-6, IL-8, and TNF-α in H9c2 cells were measured by qRT-PCR and western blot after treatment with LPS or co-treatment with APS and LPS. (c)–(e) The release of IL-6, IL-8, and TNF-α was measured by ELISA assay in H9c2 cells. Different letters above the bars (a, b, c, d, e) indicate that the means of different groups were significantly different (P < 0.05) by ANOVA. Each experiment was repeated at least three times.
APS: Astragalus polysaccharide; LPS: lipopolysaccharide; IL-6: interleukin-6; IL-8: interleukin-8; TNF-α: tumor necrosis factor-alpha; qRT-PCR: quantitative real-time polymerase chain reaction; ELISA: enzyme-linked immunosorbent assay; ANOVA: one-way analysis of variance.
***P < 0.001 vs control group; #P < 0.05, ##P < 0.01, ###P < 0.001 vs LPS group.

