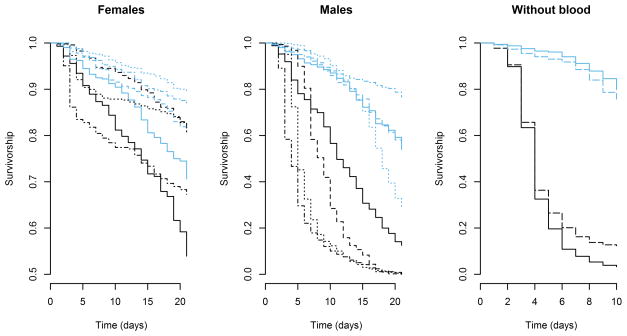
Figure 1.
Survivorship curves for 4 replicates of female and male mosquitoes under nectar-rich and nectar-poor conditions. The blue lines represent nectar-rich environments, and the black lines nectar-poor environments. For females (left panel) and males (center panel), corresponding paired symbols represent trials from the same replication. A shorter trial (without blood) illustrated the impact of sugar on female survival in the absence of a blood source (right panel). Here, solid lines represent females, and dashed lines males

