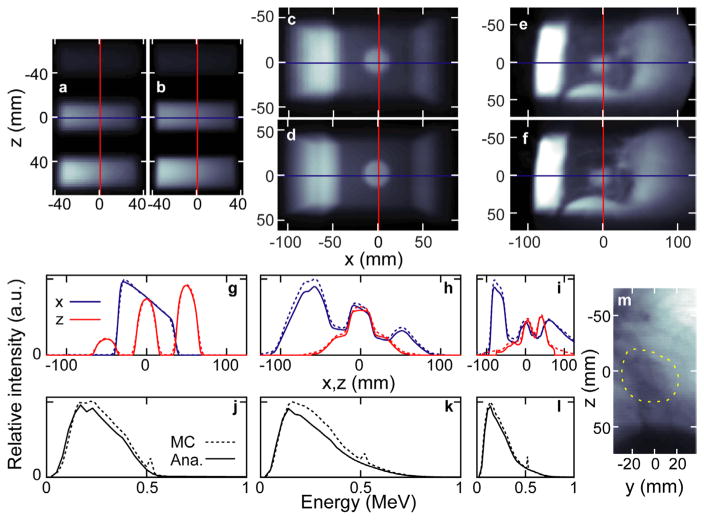
Figure 2.
The MCNP ((a), (c) and (e)) and analytical method ((b), (d) and (f)) simulated scatter images are shown for the three phantoms: 3C, LT, and LTCT (left to right, respectively). The absolute profiles from each above image (corresponding to the overlaid lines in (a)–(f)) along the x and z dimensions are shown in panels (g)–(i). The unnormalized spectra of the above simulated images are shown in (j)–(l). The 6 MV FFF transmission image (at 50 cm from isocenter) simulated for the LTCT is shown in (m) with the tumor circled (dashed line).

