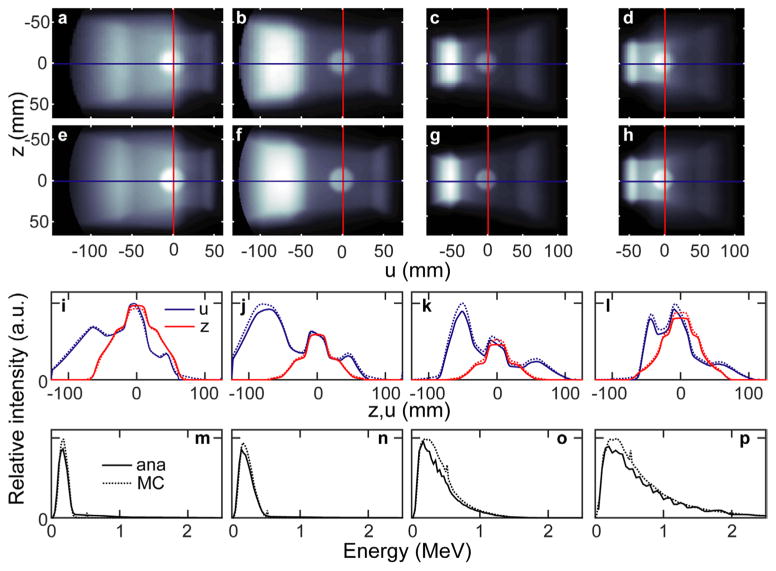
Figure 4.
The MCNP ((a)–(d)) and analytically ((e)–(h)) simulated scatter images are shown for the LT phantom irradiated at different source angles: from left to right θg = 330, 300, 240, 210°. The absolute profiles from each above image (corresponding to the overlaid lines in (a)–(h)) along the x and z dimensions are shown in panels (i)–(l). The unnormalized spectra of the above simulated images are shown in (m)–(p).

