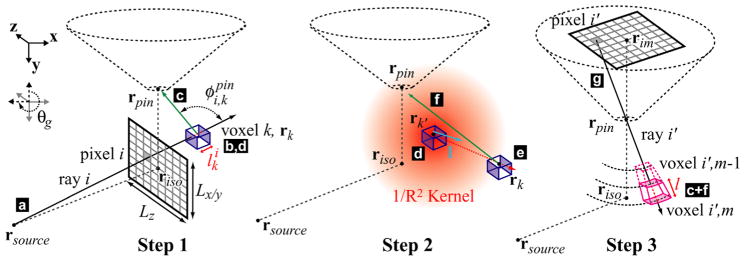
Figure A1.
The analytical simulation method is described with an illustration. The variables corresponding to each letter label are given in figure A2. In Step 1, each ray (indicated by (a), of solid angle Ωi) is traced through the phantom and attenuated. The number of photons reaching each voxel (b) is recorded. The number and energy of photons scattered towards the pinhole is recorded (c). The total number of n = 1 scattered photons and their average spectrum (d) are used as the starting point of Step 2, in which propagation of (d) is modeled with a convolution/superposition algorithm. The total number and spectrum of photons that scatter from the n − 1 round (into the n round, (e)) is used to seed progressive rounds, while the fraction of photons scattered towards the pinhole is recorded (f). Finally, all of the photons scattered by each voxel are summed ((c) + (f)) in Step 3, and attenuated by tracing along rays that pass through the pinhole to each detector pixel (g).

