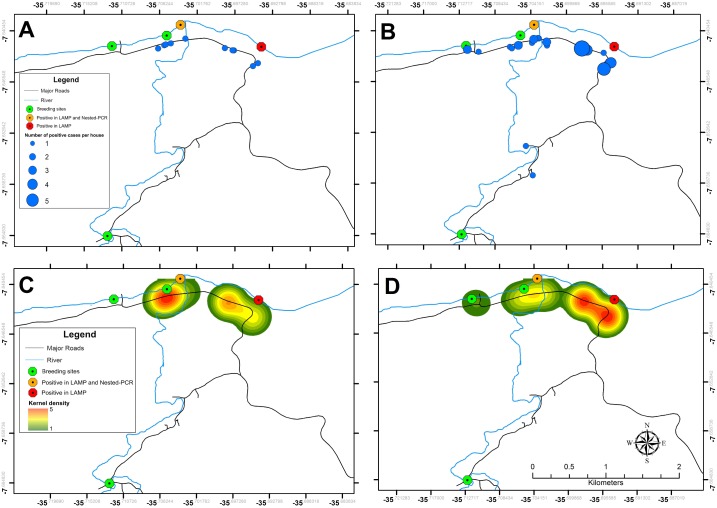
Fig 6. Risk maps of the schistosomiasis incidence according to Kato-Katz and SmMIT-LAMP results.
(A) Distribution of cases by households including in the parasitological survey using Kato-Katz. (B) Distribution of cases by household using LAMP assay. (C) Kernel risk map of the occurrence of cases by Kato-Katz method. (D) Kernel risk map of the occurrence of cases by the LAMP assay.

