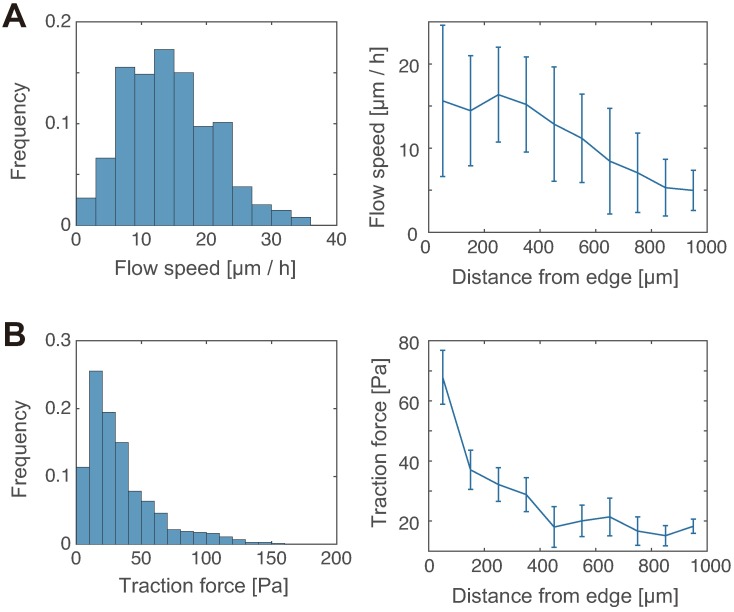
Fig 2. Quantification of tissue flow speed and traction force strength.
(A) Histogram of the flow speed in the tissue within 500 μm from the tissue edge (left; n >100 from three independent experiments), and the flow speed plotted against the distance from the tissue edge (right; n >10 at each data point). (B) The traction force data are presented in the same way as the flow speed data in (A).

