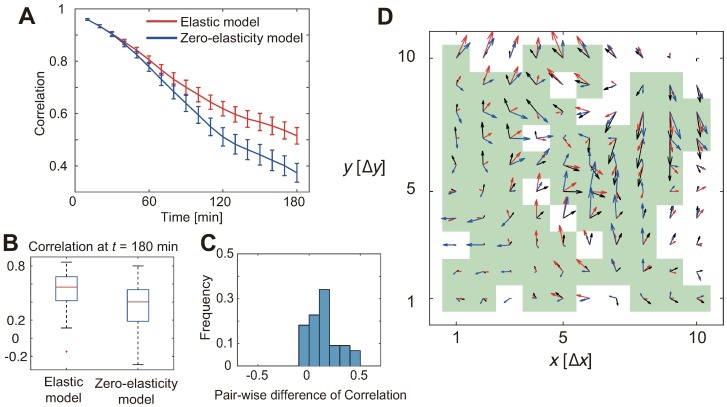
Fig 3. Traction force forecast.
(A) Correlation between the observed and predicted traction force fields. The mean and standard error (S.E.; n = 44 from three independent experiments) are plotted against the time lapse. Red and blue lines show the forecasts by the elastic model and the zero-elasticity model, respectively. (B) The predictive performance at the last time point. Each blue box shows upper and lower quartiles. The horizontal red, upper black, and lower black lines indicate the median, maximum, and minimum values, respectively, disregarding the outliers. (C) The difference in the data reproducibility, in terms of the correlation of the actual data and the reproduced data, between the elastic and zero-elasticity models. The histogram was taken in a sample-wise manner; that is, each point corresponds to a single movie. The elastic model shows statistically significant superiority (p <10−4, Wilcoxon signed-rank test). (D) A representative image of force fields at the last time point (t = 180 min). The black arrows show observed force vectors, while the red and blue arrows show forecasts by the elastic and zero-elasticity models, respectively. The green squares indicate grid points where the forecast by the elastic model was better than that by the zero-elasticity model. Δx = Δy = 29.4 μm.

