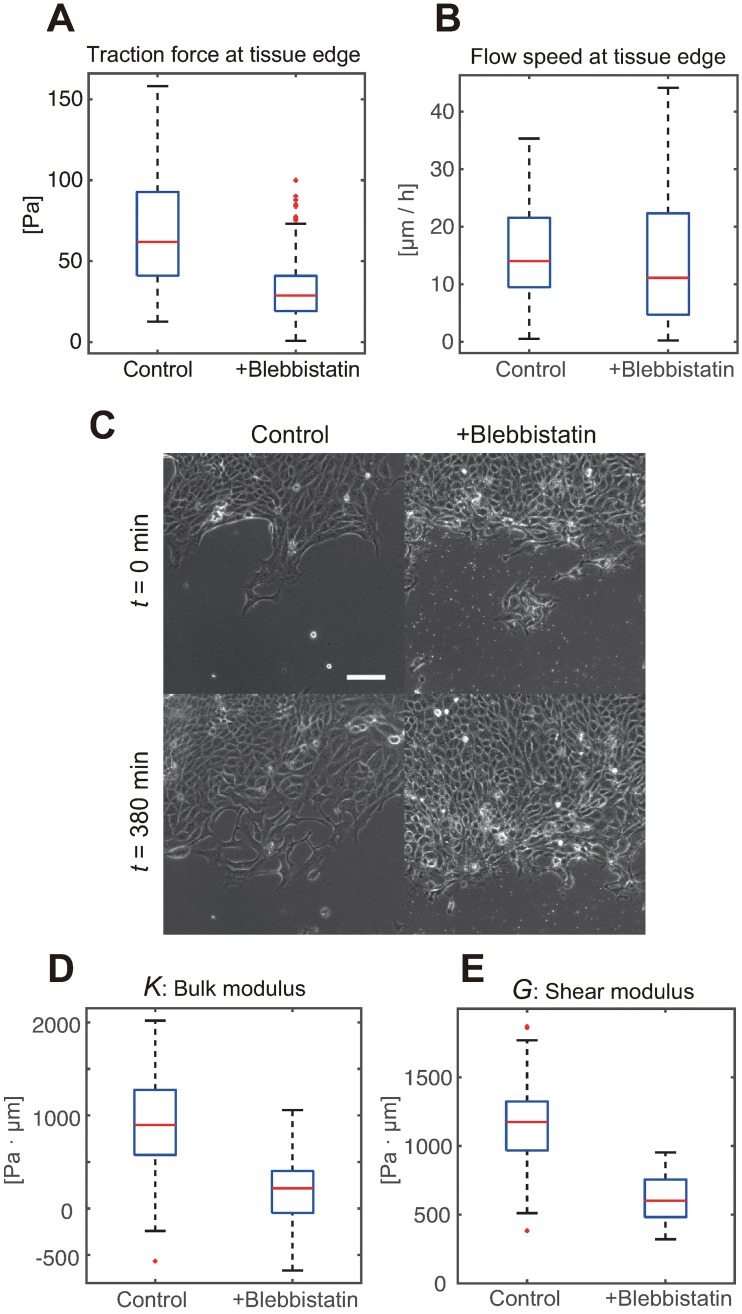
Fig 4. Estimated elastic moduli of the MDCK cell monolayer with/without myosin inhibition.
(A) Traction force strength at the tissue edge. The traction force vectors within 100 μm from the tissue edge were collected (n >100 in both control and blebbistatin treatment groups). Each blue box shows upper and lower quartiles. The horizontal red, upper black, and lower black lines indicate the median, maximum, and minimum values, respectively, expect for the outliers. (B) Flow speed at the tissue edge computed as the traction force strength. The sheet migration under the motor inhibition did not slow down despite of the weakened traction force. (C) Phase contrast images of the advancing front, exemplifying that the advancement of the blebbistatin-treated tissue did not slow down (scale-bar = 100 μm). (D) Boxplots show the bulk modulus estimated by our method, based on the movies obtained in the standard setting (control, n = 44 from three independent experiments), and from tissues treated with blebbistatin (+blebbistatin, n = 9 from two independent experiments). (E) The shear modulus results are presented in the same way as the bulk modulus results in (D).

