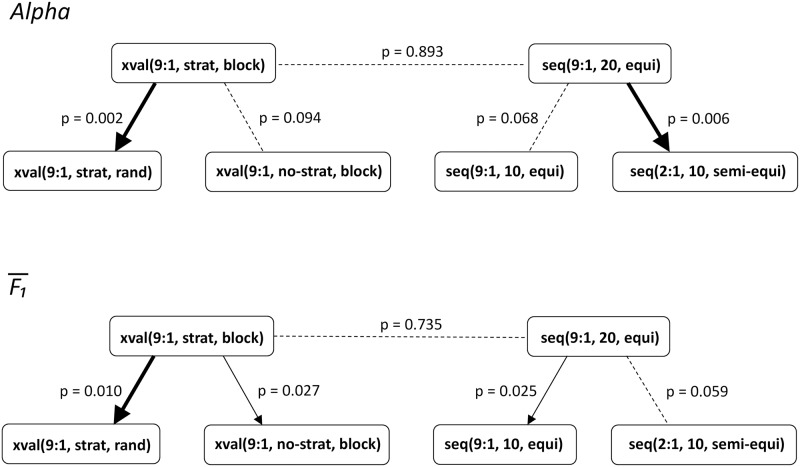
Fig 11. Differences between pairs of estimation procedures according to the Wilcoxon signed-rank test.
Compared are the average absolute errors, measured by Alpha (top) and (bottom). Thick solid lines denote significant differences at the 1% level, normal solid lines significant differences at the 5% level, and dashed lines insignificant differences. Arrows point from a procedure which incurs smaller errors to a procedure with larger errors.

