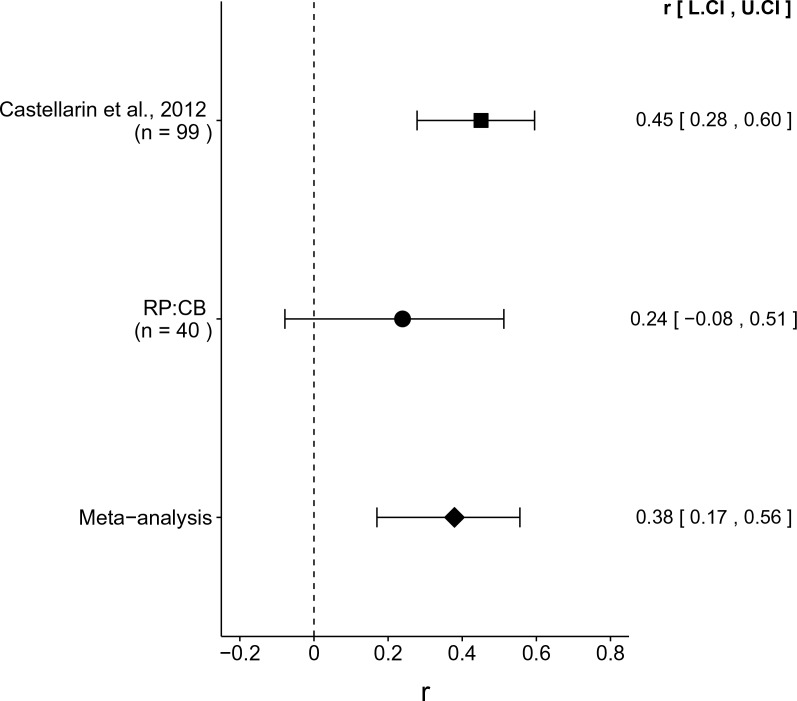
Figure 3. Meta-analyses of each effect.
Effect size (r) and 95% confidence interval are presented for Castellarin et al. (2012), this replication attempt (RP:CB), and a meta-analysis to combine the two effects. To directly compare and combine the results of both studies, the qPCR results for RP:CB were used irrespective of whether the amplicon was confirmed to be F. nucleatum by sequencing. The effect size r is a standardized measure of the correlation (strength and direction) of the association between tissue type and normalized F. nucleatum DNA levels, with a larger positive value indicating CRC tissue is correlated with a higher F. nucleatum expression level. Sample sizes used in Castellarin et al. (2012) and this replication attempt are reported under the study name. Random effects meta-analysis of the abundance of F. nucleatum in CRC tissue compared to adjacent normal tissue (meta-analysis p = 5.86 × 10⁻⁴). Additional details for this meta-analysis can be found at https://osf.io/kup8d/.

