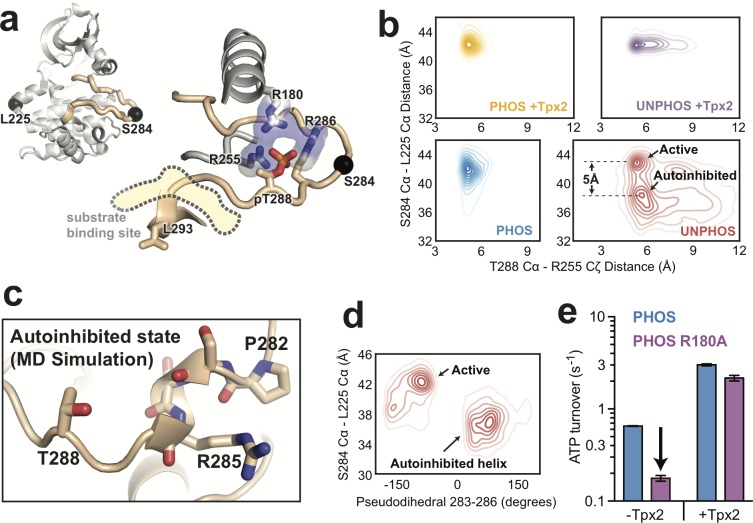
Figure 3. Molecular dynamics simulations of AurA show that phosphorylation disfavors an autoinhibited DFG-In substate and promotes a fully-activated configuration of the activation loop.
(a) Structure of active, phosphorylated AurA bound to Tpx2 and ADP (PDB ID: 1OL5) showing the interactions between pT288 and the surrounding arginine residues. The S284 and L225 Cα atoms are shown as black spheres. (b) Contour plots showing the L225 Cα - S284 Cα distances plotted against the T288 Cα - R255 Cζ distances for all four biochemical conditions. The active and autoinhibited DFG-In states observed for the unphosphorylated kinase in the absence of Tpx2 (red), and the shift in the L225-S284 distance between them, are indicated. (c) Simulation snapshot showing the helical turn in the activation loop and the position of the T288 sidechain at the C-terminal end of the helix. (d) The L225 - S284 distance is plotted against the dihedral angle defined by the Cα atoms of residues 283–286 (pseudodihedral). The helical conformation in the autoinhibited state is indicated. (e) Kinase activity (shown as ATP turnover per second) for phosphorylated WT (blue) and phosphorylated R180A (purple) AurA unlabeled FRET constructs in the presence and absence of 10 μM Tpx2. The decrease in the activity in the absence of Tpx2 due to the R180A mutation is highlighted by the arrow. Data represent mean values ± s.d.; n = 3.


