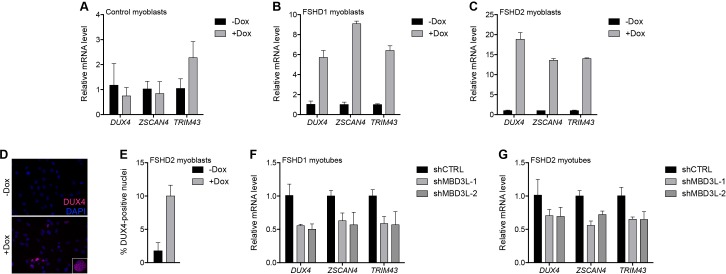
Figure 6. MBD3L2 expression de-represses the D4Z4 array.
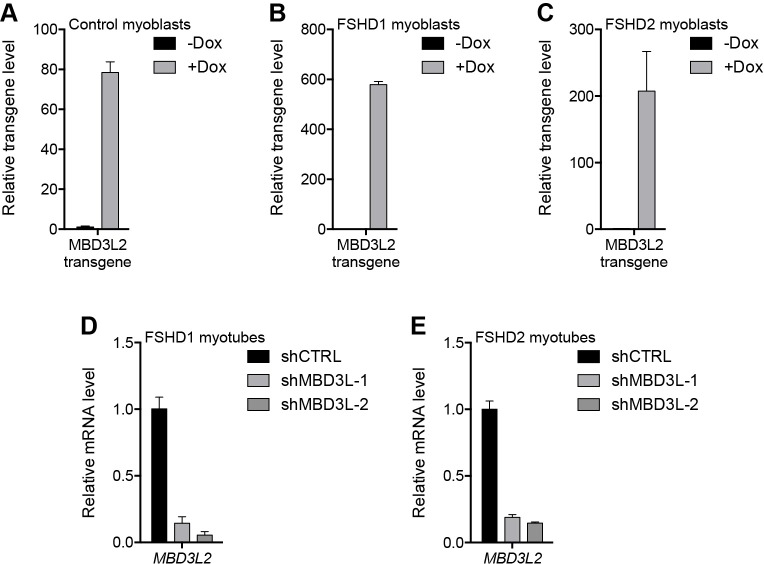
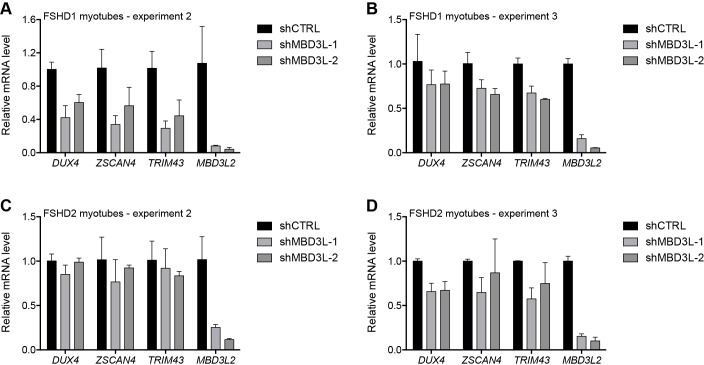
(A–C) DUX4 and DUX4 target gene expression as determined by RT-qPCR in MB2401 control (A), MB073 FSHD1 (B) or MB200 FSHD2 (C) myoblasts without (-) or with (+) doxycycline (Dox) treatment for 48 hr to induce MBD3L2 transgene expression in clonal cell lines. (D–E) DUX4-positive nuclei upon overexpression of MBD3L2 in MB200 FSHD2 myoblasts as in (C) were detected by immunofluorescence (D) and quantified by counting three fields representing >125 nuclei (E). (F–G) DUX4 and DUX4 target gene expression as determined by RT-qPCR following control (CTRL) or MBD3L family gene shRNA knockdown in MB073 FSHD1 (F) or MB200 FSHD2 (G) myotubes. Error bars denote the standard deviation from the mean of three biological replicates. Statistical significance was calculated by comparing the specific knockdown to the control knockdown for each gene using a two-tailed, two-sample Mann-Whitney U test and p was ≤0.05 for all comparisons except in (A). See also Figure 6—source data 1.


