. 2018 Mar 13;7:e32058. doi: 10.7554/eLife.32058

Figure 2. CLV enhances plasticity in spared corticospinal networks and improves functional recovery after unilateral SCI.

(a) Top 50% CLV significantly improved recovery of forelimb function compared to Rehab alone. Sustained recovery was observed on week 12 after the cessation of stimulation, indicating lasting benefits. (b) Unilateral SCI caused substantial damage to gray matter, rubrospinal, and propriospinal tracts in the right hemicord, while largely sparing the right corticospinal tract and the entirety of the left hemicord. (c) ICMS reveals that Top 50% CLV significantly increases the area of the forelimb motor cortex evoking rehabilitated grasping movements compared to Rehab alone (N = 6,6). (d) Retrograde transneuronal tracing with PRV-152 was performed to evaluated anatomical connectivity from the left motor cortex neurons, left red nucleus neurons, and right C3/4 propriospinal neurons to grasping muscles in the trained (right) forelimb. Top 50% CLV restores connectivity and results in a significant increase in labeled neurons in the motor cortex compared to Rehab alone (N = 5,6). No changes were observed in red nucleus or C3/4 propriospinal neurons. Black boxes indicate ROIs; gray dot indicates lesion epicenter; inset shows injected muscles. (e) CLV does not affect lesion size. In all panels, gray circles denote individual subjects. In all panels, ***p<0.001, **p<0.01, *p<0.05 for t-tests across groups. Error bars indicate S.E.M.

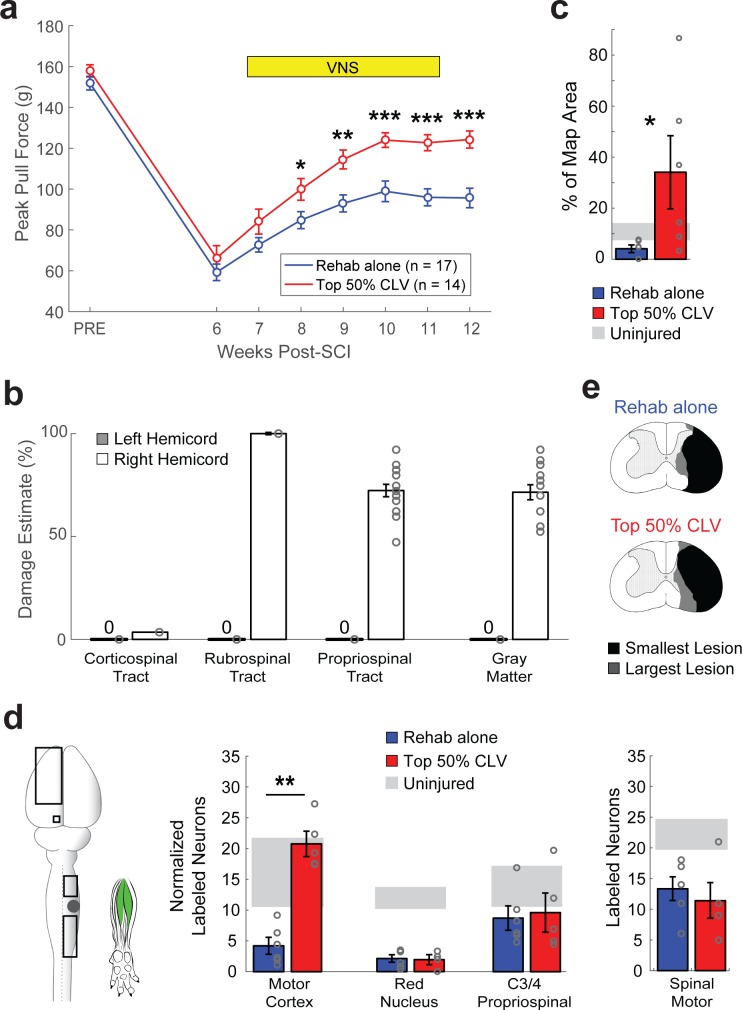
Figure 2.

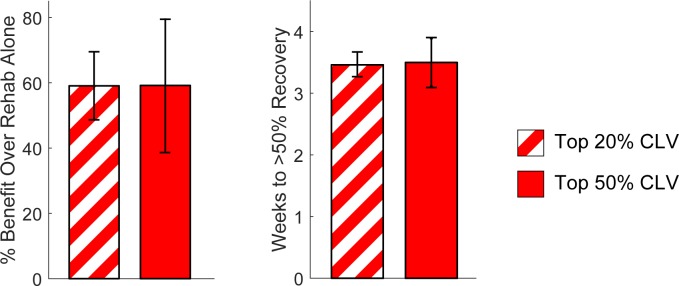
Figure 2—figure supplement 1. Top 20% CLV and Top 50% CLV display comparable recovery.

Figure 2—figure supplement 1.

We tested the hypothesis that more pairings of VNS would increase recovery after unilateral SCI. To do so, we compared recovery of forelimb function at in rats that received either Top 20% CLV or Top 50% CLV, resulting in approximately 2.5 fold more stimulation pairings. (A) As expected (Hays et al., 2014b), Top 20% CLV and Top 50% CLV displayed a comparable degree of recovery (Top 20% CLV v. Top 50% CLV, Unpaired t-test, p=0.99). (B) Similarly, more stimulations did not accelerate the rate of recovery, as assessed by the number of weeks of CLV required to reach 50% recovery (Top 20% CLV v. Top 50% CLV, Unpaired t-test, p=0.92). Together, these findings suggest that timing stimulation with the successful trials is more important that the total amount of stimulation pairings. Data represent mean ± SEM.

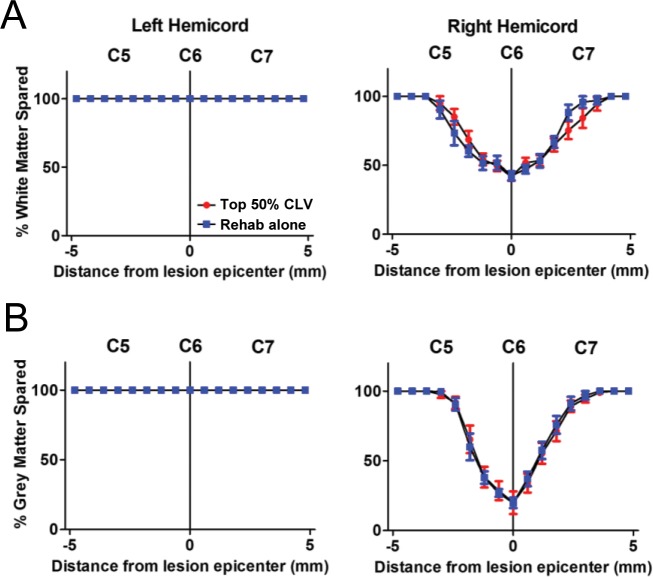
Figure 2—figure supplement 2. CLV does not affect lesion size after Unilateral SCI.

Figure 2—figure supplement 2.

Consistent with previous studies in models of ischemic stroke, intracerebral hemorrhage, or traumatic brain injury, CLV does not affect lesion size or extent (Khodaparast et al., 2016; Pruitt et al., 2016; Hays et al., 2014a; Hays et al., 2016; Khodaparast et al., 2013; Khodaparast et al., 2014). After right unilateral SCI, no differences were observed in the extent of white matter damage (A) or gray matter damage (B) between the Top 50% CLV group and the Rehab alone group. The absence of differences in lesion size with CLV confirm that neuroprotective effects cannot account for the differences in recovery. Data represent mean ± SEM.

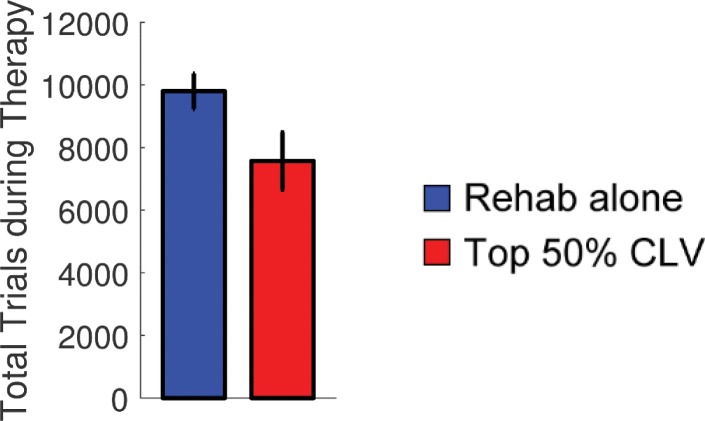
Figure 2—figure supplement 3. CLV does not influence the number of trials performed during rehabilitative training.

Figure 2—figure supplement 3.

Greater intensities of task-oriented rehabilitative training are associated with better outcomes after neurological injury (Kwakkel et al., 1999). Thus, it was possible that CLV could improve recovery by increasing motivation and subsequently leading to more intensive rehabilitative training. We tested whether CLV increased the number of trials performed during rehabilitative training. After unilateral SCI, no differences in the total number of trials performed was observed between the Top 50% CLV group and Rehab alone group (Unpaired t-test, p=0.07). Contrary to the notion that CLV may increase training intensity, rats receiving Top 50% CLV displayed a trend towards a reduced total number of trials performed. Together, these findings confirming that CLV-dependent increases in motivation or task-focused repetition cannot explain improved recovery. Data represent mean ± SEM.

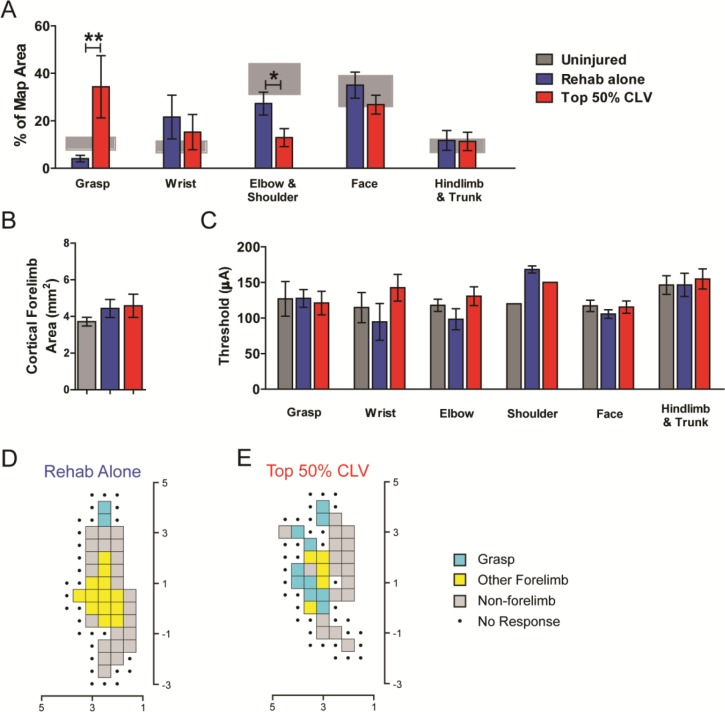
Figure 2—figure supplement 4. Motor Cortex Movement Representations.

Figure 2—figure supplement 4.

(A) CLV-dependent changes in motor cortex movement representations as assessed with ICMS were observed after unilateral SCI, consistent with a sparing of the CST. CLV significantly increased the representation of grasp movements compared to Rehab alone (Unpaired t-test, Top 50% CLV v. Rehab alone, p<0.01). The representation of proximal elbow and shoulder movements was decreased in the Top 50% CLV group, likely to accommodate the expansion of grasp movement without changing the total area of forelimb representation. No differences were observed in non-forelimb movement representations. (B) After unilateral SCI, no differences in total forelimb representational area were observed (F[2,18]=1.05, p=0.37). (C) Stimulation thresholds to evoke movement were comparable across groups. Example ICMS movement representation maps from subjects with unilateral SCI at the conclusion of therapy after (D) Rehab alone and (E) Top 50% CLV. Note the expansion in the area of motor cortex generating grasp movements after Top 50% CLV. Each square represents a 0.25 mm2 (0.5 × 0.5 mm) area. Electrode penetrations occurred in the middle of each square. Data represent mean ± SEM. *p<0.05; **p<0.01.

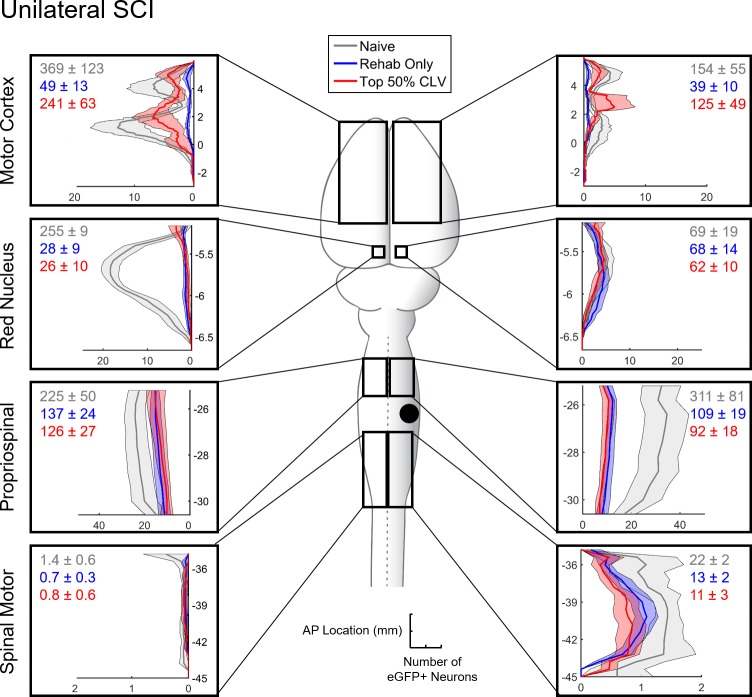
Figure 2—figure supplement 5. Distribution of eGFP+ neurons with Rehabilitation alone or Top 50% CLV after Unilateral SCI.

Figure 2—figure supplement 5.

We performed retrograde transneuronal tracing using PRV-152 to identify networks of neurons that were synaptically connected to forelimb grasping muscles in rats that received either Rehab alone or Top 50% CLV after unilateral SCI. The boxes in the center schematic show the areas throughout the neuraxis where eGFP+ labeled neurons were quantified. Boxes along each side of the schematic show the anterior-posterior distribution of eGFP+ neurons in each area in each hemisphere. Y axis denote distance from bregma in mm. X values represent the average number of eGFP+ neurons for each group using a moving average across ten histological sections. Values in the top corner of each box indicate the total number of labeled neurons in each region for each group. After unilateral SCI, CLV increases labeled neurons in the motor cortex compared to Rehab alone. Solid lines indicate mean and shaded area denotes SEM. The black circle indicates the location of the impactor tip during SCI.