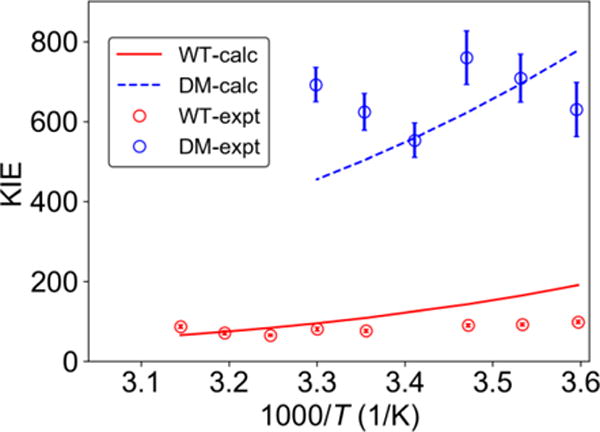
Figure 8.

Experimentally measured (data points with error bars) and theoretically calculated (solid and dashed curves) KIEs for WT and DM SLO. The calculated curves were obtained by scaling the PMFs for WT and DM by 0.95 and 1.15, respectively. The experimental data were obtained from Ref. 11 for WT and Ref. 15 for DM SLO.
