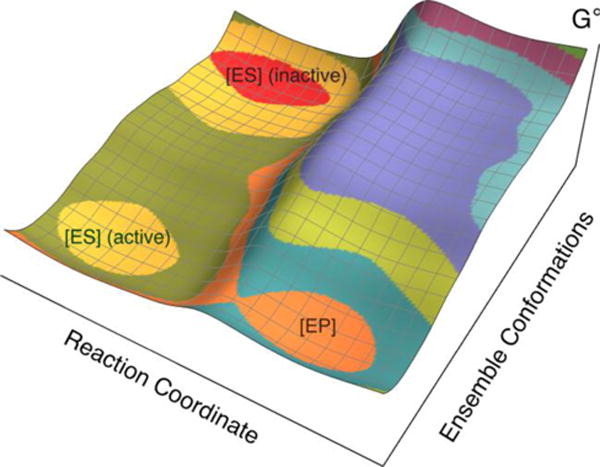
Figure 9.

Schematic depiction of the free energy landscape for soybean lipoxygenase. The axis labeled “Ensemble Conformations” corresponds to conformational sampling of the overall enzymatic system converting inactive enzyme-substrate configurations (red basin) to active enzyme-substrate configurations (yellow basin) that are aligned for proton transfer from C11 of linoleic acid to the oxygen of the iron-coordinated hydroxide. The free energy of the basin associated with active configurations (yellow) is higher than that associated with inactive configurations (red), indicating an equilibrium constant that is significantly less than unity for the conversion from inactive to active configurations. The axis labeled “Reaction Coordinate” corresponds to the PCET reaction, which is thought to occur by a nonadiabatic PCET mechanism from an active configuration (yellow basin) to the product (orange basin). Figure modelled after figure in Ref. 15.
